Your data guide to football betting, Dan Tracey shows you where the numbers point before the market catches up.
The biggest sports teams in the premier league can rake in some serious cash for players and coaches alike. By the end of the 2022-2023 season, the Premier League has generated an estimated £5bn
The majority of this comes from broadcasting fees (bringing in an estimated £3.1 billion) and commercial and sponsorship deals, including media rights, merchandise, and sponsorships from betting sites (bringing in an estimated £1.65 billion).
But where is all this money spent? Obviously, a lot of this cash goes on player salaries and signing new players. So which Premier League teams are spending the most money, and which are seeing the lowest return on their investments?
We’ve looked at the net spending over the last ten seasons, commercial value, and the purchase value for 20 of the biggest Premier League teams and compared them to their total number of league title wins and their proportion of wins to losses over the last ten seasons to find out who are the worst spenders in the Premier League.
The Worst Premier League Spenders
In this section, we delve deep into the leanest pockets in the Premier League, examining those teams whose Spend Score - an index attesting to their prudent financial management - has been the lowest.
Anchoring our list is Luton, though with their recent entry to the League, we tend to keep this on the lower end of our judgement scale. Taking the limelight with an undeniable density of fiscal missteps is Manchester United, boasting a lowly score of 3.72, largely due to prodigious spending since 2014. We'll also scrutinize Tottenham, whose silverware-starved run casts a gloomy shadow over their 4.24 Spend Score, and West Ham, whose only European accolade is shrouded in controversy, hence, making their 4.63 score up for debate.
Unpacking the Premier League's Worst Spenders
Luton - 3.25/10 Spend Score

It is perhaps a little harsh to classify Luton as the worst spenders in the Premier League, as they have only been in the division for a couple of weeks. With no average position data to hand just yet, they have created something of a statistical anomaly. Therefore, if we take them out of the equation, we can see who really fails to find value for money.
Manchester United - 3.72/10 Spend Score
Manchester United has the unwanted title of the genuine worst Premier League spenders, as they have generated a spending score of 3.8. The main reason can be attributed to more than £1bn worth of net spend since the start of the 2014/15 season. Four trophies may have been delivered during that time, but not the prize that the Red Devils were so used to winning in the past. This club may be prepared to spend money, but whether it has spent it wisely is another argument altogether.
Tottenham - 4.24/10 Spend Score
While it is a similar argument that can be made for the team in second. The club in question is Tottenham and whereas United above have won four trophies during the last 10 seasons, Spurs have won none. In fairness to the North London outfit, their net spend is not as eyewatering as their big six rivals. At the same time, one wonders whether increasing the current deficit of £427m would have led to their lengthy trophy drought being ended.
West Ham - 4.63/10 Spend Score
Moving up to third on the list is none other than West Ham. They may have won the UEFA Conference League last season but somewhat controversially, we are not considering this as a major trophy for our data collection. The East London outfit may not be the biggest spenders in the Premier League but they are let down by their average positioning. A combination of factors has been the reasoning behind their current spend score and this is something that the club will look to address in 23/24.
The Most Valuable Premier League Team
Dive into the realm of Premier League giants, exploring the vast commercial values that place them at the pinnacle of football. Manchester City, crowned champions, tops the list with an eye-watering commercial value of £1,075 billion, closely followed by Arsenal and then Chelsea. In this section, we delve into these thriving teams’ worth and highlight their most valuable players, illuminating the individual talent that contributes to their impressive financial standings.
Manchester City - Commercial Value of £1,075,000,000

Ranking as the most valuable Premier League team is Manchester City, which enjoys a commercial value of £1,075 billion. Man City’s most valuable player right now is Centre-Forward Erling Haaland, who has a market value of £146 million.
Arsenal - Commercial Value of £1,040,600,000
The second most valuable Premier League team is Arsenal which has a commercial value of £1,040 billion. Bukayo Saka is currently Arsenal’s most valuable player with an estimated market value of £94.6 million.
Chelsea - Commercial Value of £843,617,000
Chelsea has a commercial value of £843.6 million, ranking them as the third most valuable team in the Premier League. Chelsea’s most valuable player right now is Enzo Fernandez, their attacking midfielder, who is worth an estimated £73.1 million.
The Worst Performing Premier League teams
Unveiling the struggles and the hurdles of Premier League reliability, this section casts light on the league's underdogs - Fulham, Nottingham Forest, and Burnley. It analyses their rather precarious average finishing positions over the past decade.
Fulham - 16.5 Average League Position

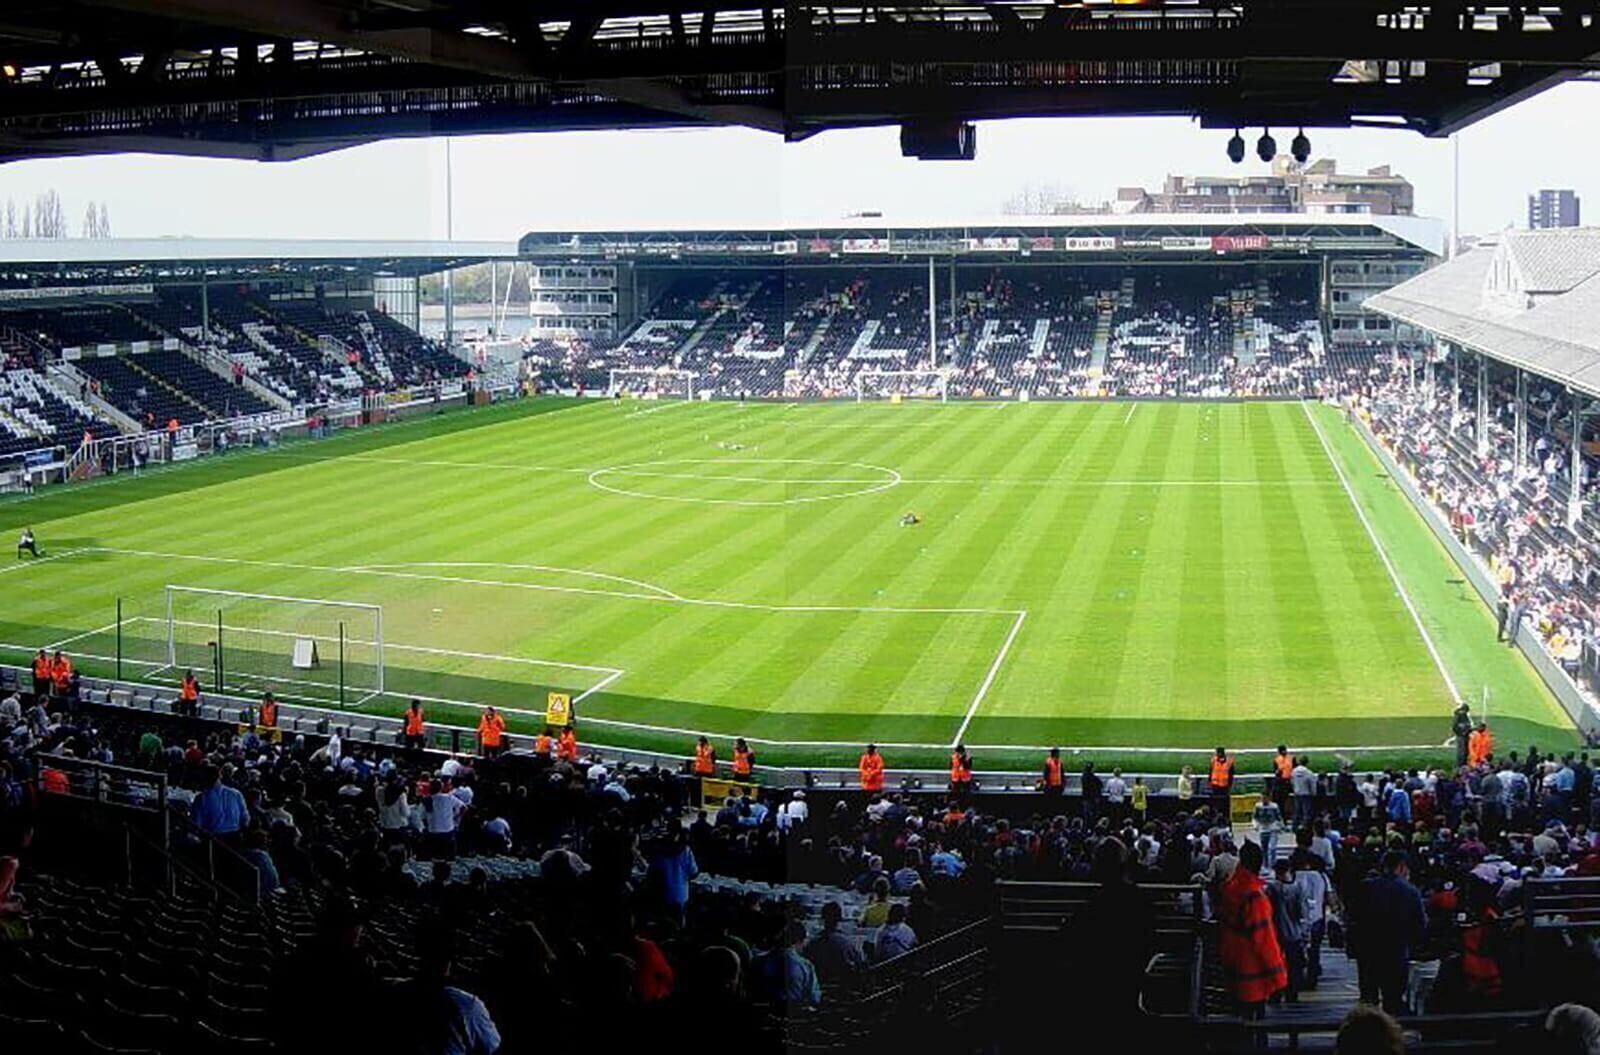
Fulham have the unenviable position of being the team with the highest average Premier League finishing position across the past 10 seasons. During the past decade, the West Londoners averaged 16.5.
Although there will have been reasons to be cheerful in West London, as the Cottagers finished in the comfort of midtable at the end of the 2022/23 campaign.
Nottingham Forest - 16 Average League Position
Just half a position behind Fulham are Nottingham Forest. Steve Cooper’s men managed to stay up on their return to the Premier League for the 2022/23 season. The City Ground outfit finished 16th last time around and would be more than happy with this by May 2024.
Burnley - 14.57 Average League Position
Premier League returnees Burnley have the third-highest average finish at 14.57. Vincent Kompany’s men won promotion from the EFL Championship a few months ago and will now look to avoid relegation. Like Nottingham Forest, if they can maintain their average, there will certainly be no complaints at Turf Moor.
| Club | Average Pos |
|---|---|
| Manchester City | 1.70 |
| Liverpool | 3.70 |
| Manchester United | 4.40 |
| Chelsea | 4.60 |
| Arsenal | 4.80 |
| Tottenham | 4.80 |
| Wolves | 10.00 |
| Everton | 10.50 |
| West Ham | 10.90 |
| Brentford | 11.00 |
| Newcastle | 11.78 |
| Crystal Palace | 12.40 |
| Brighton | 13.00 |
| Bournemouth | 14.00 |
| Aston Villa | 14.43 |
| Sheffield United | 14.50 |
| Burnley | 14.57 |
| Nottingham Forest | 16.00 |
| Fulham | 16.50 |
| Luton | 0.00 |
The Premier League teams with the biggest net spend
Unmasking the financial prowess that propels the Premier League's finest onto the pitch, this section presents an in-depth analysis of club expenditures, specifically focusing on the three teams with the highest net spend over the past decade - Manchester United, Manchester City, and Arsenal.
Manchester United - £1,075,937,400 Net Spend

Manchester United is the only team to have a net spend of £1 billion on transfers over the last ten seasons. Man United’s most expensive signing was Paul Pogba, who the club bought for a massive £94.5 million from Juventus in 2016.
Manchester City - £826,735,200 Net Spend
Manchester City comes in second place for the biggest net spend, having spent £846.6 million in the last ten seasons. Man City made history two years ago by buying Jack Grealish for £100 million from Aston Villa, making him the most expensive English and British transfer ever.
Arsenal - £824,413,200 Net Spend
In third place for the most significant expenditure over the last ten seasons is Arsenal. While were it not for a couple of extra million, it would be them surpassing Manchester City. However, just like last season’s drama on the pitch, the Gunners have fallen just short when it comes to beating their nearest rivals.
Methodology
Starting with a list of the 20 current teams playing in the Premier League today, we analysed each one on the following factors:
The teams with the fewest titles: The total number of major titles (Premier League, FA Cup, EFL Cup, Champions League, Europa League, and the Championship) won by each team in the last 10 years according to Wikipedia.
The average league positions: This was calculated by averaging the final season positions of each team over the last 10 seasons of the Premier League.
The most valuable teams: The commercial value of each team in 2023, according to Transfer Markt.
The teams with the biggest net spend: The total transfer expenditure of each team over the last 10 seasons of the Premier League.
We then gave each team a normalised score out of ten for each of the factors, before taking an average across each of these scores to reach our final overall score out of ten.
Data correct as of 21st August 2023
Net Spend in Millions by Club
| Club | Total | 23/24 | 22/23 | 21/22 | 20/21 | 19/20 | 18/19 | 17/18 | 16/17 | 15/16 | 14/15 |
|---|---|---|---|---|---|---|---|---|---|---|---|
| Arsenal | -958.62 | -200.79 | -168.1 | -136 | -66.85 | -107.15 | -71.05 | 9.15 | -102.65 | -24 | -91.18 |
| Aston Villa | -435.73 | -90.1 | -46.14 | -2.8 | -98.58 | -156.5 | -2.95 | 15.03 | -39.7 | -1.85 | -12.14 |
| Bournemouth | -300.75 | -126.19 | -83.1 | 14.26 | 92.85 | -20.29 | -71.4 | -34.3 | -17 | -54.46 | -1.12 |
| Brentford | -30.98 | -55.01 | -47.9 | -37.2 | 54.7 | -0.39 | 28.4 | 3.85 | 9.25 | 15.12 | -1.8 |
| Brighton | -36.19 | 113.25 | 82.2 | 3.5 | -29.5 | -53.24 | -73.5 | -66.1 | -8.75 | -13.47 | 9.42 |
| Burnley | -145.31 | -87.8 | 33.26 | -8.9 | 1.2 | -10.3 | -25 | 14.26 | -44.4 | -5.01 | -12.62 |
| Chelsea | -939.98 | -130.2 | -543.69 | 30.94 | -190.05 | 112.27 | -125.55 | -65.9 | -23.9 | -9.01 | 5.11 |
| Crystal Palace | -268.59 | -20 | -41.15 | -85.62 | -2.4 | 47.78 | -11.5 | -52.95 | -51 | -23.4 | -28.35 |
| Everton | -296.38 | 23.5 | 25.4 | 6.5 | -69.95 | -33.2 | -71.15 | -76.82 | -25.2 | -37.2 | -38.26 |
| Fulham | -200.71 | 23.7 | -49.3 | -15.8 | -37.25 | -8.5 | -111.15 | -1.97 | -1.77 | 0.86 | 0.47 |
| Liverpool | -426.26 | -70.3 | -56.6 | -57.45 | -66.85 | 37.6 | -140.88 | 10.85 | 5.48 | -35.95 | -52.16 |
| Luton | -9.07 | -19.85 | -1.27 | 0.5 | 9.34 | 1.6 | 0.12 | 0.49 | |||
| Manchester City | -961.32 | -79.1 | 9.67 | -45.1 | -109.4 | -95.82 | -20.99 | -226.15 | -180.9 | -141.03 | -72.5 |
| Manchester United | -1251.09 | -153.86 | -219.63 | -110.9 | -64.3 | -155.62 | -52.15 | -152.9 | -137.75 | -55.33 | -148.65 |
| Newcastle | -607.16 | -108.6 | -171.29 | -130.5 | -38.73 | -37.26 | -8.7 | -25.28 | 36.63 | -102.28 | -21.15 |
| Nottingham Forest | -203.3 | -33.25 | -190.25 | -6.12 | 0.61 | 9.75 | -17.93 | 9.85 | 14.14 | 9.5 | 0.4 |
| Sheffield United | -117.27 | -12 | -4.5 | 27.7 | -62.7 | -72.15 | 5.7 | -5.64 | 4.19 | 1.4 | 0.73 |
| Tottenham | -496.76 | -82 | -139.15 | -61.28 | -97.2 | -86 | 5.35 | -17.2 | -31.2 | 16.25 | -4.33 |
| West Ham | -407.59 | 83.6 | -164.95 | -70.27 | -9.29 | -64.32 | -87.14 | 12.22 | -42.5 | -34.19 | -30.75 |
| Wolves | -313.47 | 44.7 | -114.24 | -5.8 | -8.39 | -92.6 | -89.45 | -18.29 | -33.11 | 5.73 | -2.02 |
Market Value by Club
| Rank | Club | Market Value Euros | Trophies Won | Net Spend | Average Positions | Market Value Normalised | Trophies Normalised | Net Spend Normalised | Average Position Normalised | Total Normalised |
|---|---|---|---|---|---|---|---|---|---|---|
| Luton | 73,450,000 | 0 | -9.07 | 0.00 | 1.00 | 1 | 10.00 | 1.00 | 3.25 | |
| Manchester United | 870,300,000 | 4 | -1251.09 | 4.40 | 7.10 | 3.4 | 1.00 | 3.40 | 3.72 | |
| Tottenham | 715,300,000 | 0 | -496.76 | 4.80 | 5.91 | 1 | 6.47 | 3.62 | 4.25 | |
| West Ham | 397,150,000 | 0 | -407.59 | 10.90 | 3.48 | 1 | 7.11 | 6.95 | 4.63 | |
| Wolves | 353,180,000 | 1 | -313.47 | 10.00 | 3.14 | 1.6 | 7.79 | 6.45 | 4.75 | |
| Everton | 390,150,000 | 0 | -296.38 | 10.50 | 3.42 | 1 | 7.92 | 6.73 | 4.77 | |
| Chelsea | 980,950,000 | 6 | -939.98 | 4.60 | 7.94 | 4.6 | 3.25 | 3.51 | 4.83 | |
| Crystal Palace | 308,550,000 | 0 | -268.59 | 12.40 | 2.80 | 1 | 8.12 | 7.76 | 4.92 | |
| Newcastle | 599,000,000 | 1 | -607.16 | 11.78 | 5.02 | 1.6 | 5.67 | 7.42 | 4.93 | |
| Arsenal | 1,210,000,000 | 4 | -958.62 | 4.80 | 9.69 | 3.4 | 3.12 | 3.62 | 4.96 | |
| Liverpool | 801,300,000 | 4 | -426.26 | 3.70 | 6.57 | 3.4 | 6.98 | 3.02 | 4.99 | |
| Sheffield United | 99,500,000 | 0 | -117.27 | 14.50 | 1.20 | 1 | 9.22 | 8.91 | 5.08 | |
| Brentford | 355,500,000 | 0 | -30.98 | 11.00 | 3.16 | 1 | 9.84 | 7.00 | 5.25 | |
| Bournemouth | 326,500,000 | 1 | -300.75 | 14.00 | 2.94 | 1.6 | 7.89 | 8.64 | 5.26 | |
| Aston Villa | 615,500,000 | 0 | -435.73 | 14.43 | 5.15 | 1 | 6.91 | 8.87 | 5.48 | |
| Brighton | 350,100,000 | 0 | -36.19 | 13.00 | 3.12 | 1 | 9.80 | 8.09 | 5.50 | |
| Burnley | 202,550,000 | 2 | -145.31 | 14.57 | 1.99 | 2.2 | 9.01 | 8.95 | 5.54 | |
| Nottingham Forest | 327,380,000 | 0 | -203.3 | 16.00 | 2.94 | 1 | 8.59 | 9.73 | 5.57 | |
| Fulham | 245,550,000 | 1 | -200.71 | 16.50 | 2.32 | 1.6 | 8.61 | 10.00 | 5.63 | |
| Manchester City | 1,250,000,000 | 15 | -961.32 | 1.70 | 10.00 | 10 | 3.10 | 1.93 | 6.26 |
Trophies Won by Season
| Season | Premier League | Champions League | FA Cup | League Cup | Europa League | EFL Championship |
|---|---|---|---|---|---|---|
| 2013/14 | Manchester City | Real Madrid | Arsenal | Manchester City | Sevilla | Leicester |
| 2014/15 | Chelsea | Barcelona | Arsenal | Chelsea | Sevilla | Bournemouth |
| 2015/16 | Leicester | Real Madrid | Manchester United | Manchester City | Sevilla | Burnley |
| 2016/17 | Chelsea | Real Madrid | Arsenal | Manchester United | Manchester United | Newcastle |
| 2017/18 | Manchester City | Real Madrid | Chelsea | Manchester City | Atlético Madrid | Wolves |
| 2018/19 | Manchester City | Liverpool | Manchester City | Manchester City | Chelsea | Norwich |
| 2019/20 | Liverpool | Bayern Munich | Arsenal | Manchester City | Sevilla | Leeds |
| 2020/21 | Manchester City | Chelsea | Leicester | Manchester City | Villarreal | Norwich |
| 2021/22 | Manchester City | Real Madrid | Liverpool | Liverpool | Eintracht Frankfurt | Fulham |
| 2022/23 | Manchester City | Manchester City | Manchester City | Manchester United | Sevilla | Burnley |


