I've spent over 20 years inside the betting industry. I'll guide you to avoid the hype, ignore the noise, and steer clear of the common pitfalls that catch out everyday punters.
Much as Bookmakers are, the lottery is a national institution in the UK, with players taking part up and down the country, hoping to land the jackpot. The National Lottery is also an active charity, diverting much of its revenue to supporting community projects and improving people’s lives. With this in mind, it’s no wonder the lottery has been so popular in the UK for so long.
However, there are multiple lotteries that people in the UK can choose to play. These include the classics, like Lotto and Thunderball, and newer games, like the Postcode Lottery, Set for Life or the Health Lottery. The EuroMillions draw is also available to players in the UK, known for featuring some incredibly high jackpots, the largest of which was seen in December 2023 and stood at more than £206 million!
We’ve previously considered the Luckiest Locations for the Powerball Lottery in the United States, and with lotteries forming such a large part of the UK cultural zeitgeist, we wanted to dig a little into the data to reveal some fascinating facts and figures. Which is the UK’s favourite lottery? Which numbers and pairs are the most commonly drawn? And which UK areas have seen the most lottery wins?
Lotto is the most popular lottery in the UK, with more than 47 million searches recorded in the past 12 months
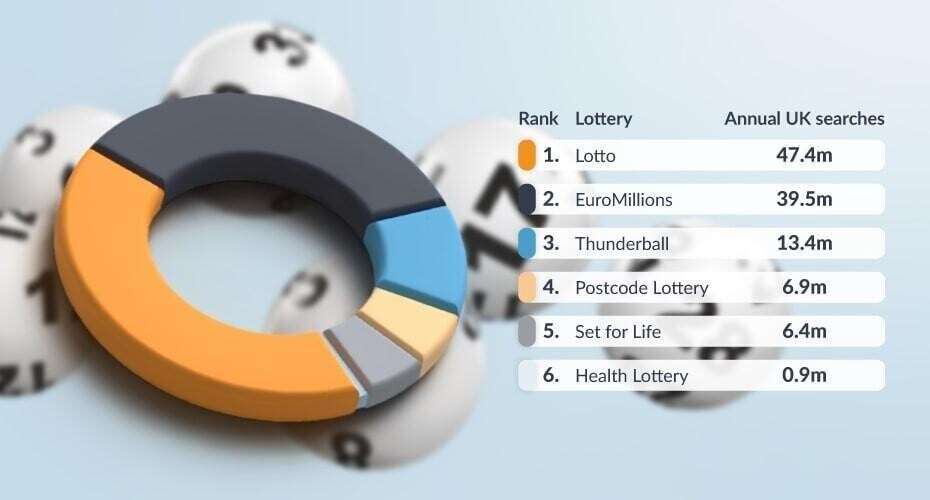
Lotto - 47.4 million UK searches in the past 12 months
Lotto is the most popular lottery in the UK, with well over 47 million searches in the past 12 months. This shows that the British people love a classic game and will turn out in droves to choose their six lucky numbers once or twice a week.
The colossal jackpots of the EuroMillions lottery make it the next most popular in the UK, with just over 39.5 million searches. In contrast, the long-running Thunderball lottery takes third place with over 13 million.
Data correct as of January 2024
Residents in Liverpool search for lotteries more than any other UK town or city

| Rank | City | Population | Total searches | Total searches per 100,000 people |
|---|---|---|---|---|
| 1 | Liverpool | 506,552 | 1,851,490 | 365,508 |
| 2 | Bolton | 184,073 | 534,690 | 290,477 |
| 3 | Swansea | 170,055 | 476,210 | 280,033 |
| 4 | Huddersfield | 141,692 | 350,590 | 247,431 |
| 5 | Newcastle upon Tyne | 286,468 | 663,630 | 231,659 |
| 6 | Leeds | 536,321 | 1,205,210 | 224,718 |
| 7 | Manchester | 470,411 | 1,048,170 | 222,820 |
| 8 | Wolverhampton | 234,015 | 487,310 | 208,239 |
| 9 | Middlesbrough | 148,219 | 301,690 | 203,543 |
| 10 | Birmingham | 1,121,408 | 2,271,550 | 202,562 |
Liverpool - 365,508 searches per 100,000 people
The people of Liverpool are the most interested in lotteries, making more than 1.85 million searches in the past year. This works out to a rate of 365,508 searches per 100,000 people, or 3.65 searches per person, the highest in the UK.
The Greater Manchester town of Bolton has the second-highest level of interest in lotteries, with over 290,000 searches per 100,000 people. That’s almost three searches per person. Swansea has the third-highest level of interest in lotteries, with this small city on the South Wales coast seeing over 476,000 searches in the last 12 months. This equals a rate of 280,033 searches per 100,000 people or 2.8 searches per person.
Data correct as of January 2024
Lotto
Lotto is the original lottery game in the UK, rebranded from the National Lottery in 2004. Lotto players choose six numbers from 1 to 59, with a minimum of three matching balls required to win a cash prize. However, matching just two balls will earn you a free Lucky Dip for the next draw, putting you in the running with a randomised set of numbers. Draws happen twice a week, on Wednesdays and Saturdays, with tickets costing £2 each.
| Rank | Region | Millionaires | % of Total |
|---|---|---|---|
| 1 | South East | 1,071 | 14.4% |
| 2 | Midlands | 1,011 | 13.6% |
| 3 | London | 886 | 11.9% |
| 4 | North West | 878 | 11.8% |
| 5 | Scotland | 692 | 9.3% |
| 6 | East | 691 | 9.3% |
| 6 | Yorkshire | 681 | 9.2% |
| 8 | South West | 572 | 7.7% |
| 9 | Wales | 408 | 5.5% |
| 10 | North East | 352 | 4.7% |
| 11 | Northern Ireland | 195 | 2.6% |
| - | United Kingdom | 7,437 |
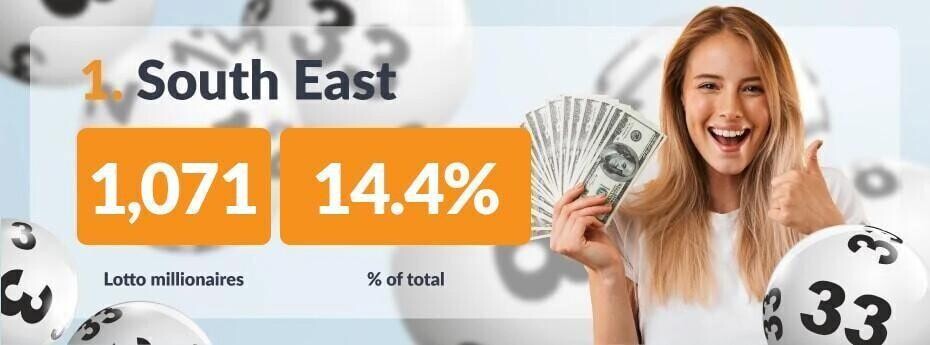
South East - 1,071 Lotto Millionaires make up 14.2% of the national total
The UK region with the highest proportion of Lotto millionaires is the South East, with 1,071 separate seven-figure winners accounting for 14.4% of all Lotto millionaires.
The Midlands region saw the second-highest number of Lotto millionaires at 1,011, which is 13.6% of the total. The London region had the third-highest Lotto millionaires at 886, 11.9% of the UK total.
The Midlands region has the highest number of Lotto players who won £50,000 or more

| Rank | Region | £50,000+ winners | % of Total |
|---|---|---|---|
| 1 | Midlands | 6,586 | 14.66% |
| 2 | South East | 6,032 | 13.43% |
| 3 | North West | 5,542 | 12.34% |
| 4 | London | 5,513 | 12.27% |
| 5 | Yorkshire | 4,208 | 9.37% |
| 5 | Scotland | 3,859 | 8.59% |
| 5 | East | 3,840 | 8.55% |
| 8 | South West | 3,715 | 8.27% |
| 9 | North East | 2,365 | 5.26% |
| 10 | Wales | 2,290 | 5.10% |
| 11 | Northern Ireland | 975 | 2.17% |
| - | United Kingdom Total | 44,925 |
Midlands - 6,586 Lotto £50k+ winners make up 14.66% of the national total
The Midlands is home to the highest number of Lotto winners who received £50,000 or more at 6,586, 14.66% of the nation’s total.
The South East has seen the second-highest number of Lotto £50k+ winners at 6,032 equal to 13.43%, while the North West had the third-highest number with 5,542 people winning £50,000 or more.
These are the most common Lotto ball drawings

The most common Lotto number is 52 - Drawn 120 times
Lotto's most commonly drawn number is 52, which has appeared 120 times since Oct 2015. This is closely followed by number 39, which has appeared 119 times, while number 37 has made 118 appearances.
The least common Lotto number is 30 - Drawn 86 times
Number 30 is the least common ball to be drawn in Lotto, appearing 86 times since October 2015. This is considerably fewer times than the most commonly drawn numbers, though they all have an equal chance of being selected.
The second-least commonly drawn numbers are 48 and 21, both appearing 87 times, while 55 and 18 have each been drawn 89 times since October 2015.
The most common pair of Lotto numbers are 2 and 54 - Drawn together 20 times
The most commonly-drawn pair of numbers is 2 and 54, with the combination appearing 20 times since October 2015. This is one more appearance than the second most common pairs, 37 and 42 and 42 and 58 which have happened 19 times.
Data correct as of March 2025
Lotto is most popular in Liverpool, being searched for more than 800,000 times
| Rank | City | Population | Lotto searches | Lotto searches per 100,000 people |
|---|---|---|---|---|
| 1 | Liverpool | 506,552 | 801,330 | 158,193 |
| 2 | Swansea | 170,055 | 212,240 | 124,807 |
| 3 | Bolton | 184,073 | 228,030 | 123,880 |
| 4 | Huddersfield | 141,692 | 149,920 | 105,807 |
| 5 | Newcastle upon Tyne | 286,468 | 301,950 | 105,404 |
| 6 | Middlesbrough | 148,219 | 137,590 | 92,829 |
| 7 | Leeds | 536,321 | 486,280 | 90,670 |
| 8 | Wolverhampton | 234,015 | 207,280 | 88,576 |
| 9 | Manchester | 470,411 | 400,980 | 85,240 |
| 10 | Glasgow | 631,690 | 526,610 | 83,365 |
Liverpool - 158,193 Lotto searches per 100,000 people
Liverpool is the UK city where Lotto is the most popular, with over 158,000 searches per 100,000 people in the last six months. This suggests that the people of this port city in the North West of England have a positive outlook and feel that luck is on their side.
The Welsh city of Swansea saw the second-highest rate of Lotto searches, with 124,807 per 100,000 people, while Bolton claimed third place with a rate of 123,880.
Data correct as of January 2024
EuroMillions
Since its launch in 2004, EuroMillions has become one of the main lotteries in the UK and offers the largest prizes to potential winners. EuroMillions is open to players in nine European countries, including Austria, Belgium, France, Ireland, Luxembourg, Portugal, Spain, Switzerland and the UK.
In the game, players select five numbers from 1 to 50 and two Lucky Stars numbered from 1 to 12. You only need to match two main numbers to start winning cash prizes, and all ticket holders are automatically entered into the UK Millionaire Maker draw, giving you a second chance to win big. Tickets cost £2.50 each, and draws happen twice weekly, on Tuesdays and Fridays.
The UK has the highest proportion of EuroMillions jackpot winners
| Rank | Country | Jackpot Winners | Percentage of Total |
|---|---|---|---|
| 1 | UK | 46 | 27.1% |
| 2 | France | 35 | 20.6% |
| 3 | Spain | 33 | 19.4% |
| 4 | Portugal | 18 | 10.6% |
| 5 | Belgium | 16 | 9.4% |
| 6 | Ireland | 8 | 4.7% |
| 7 | Switzerland | 7 | 4.1% |
| 8 | Austria | 5 | 2.9% |
| 9 | Luxembourg | 2 | 1.2% |
| - | Total | 154 | 100.0% |
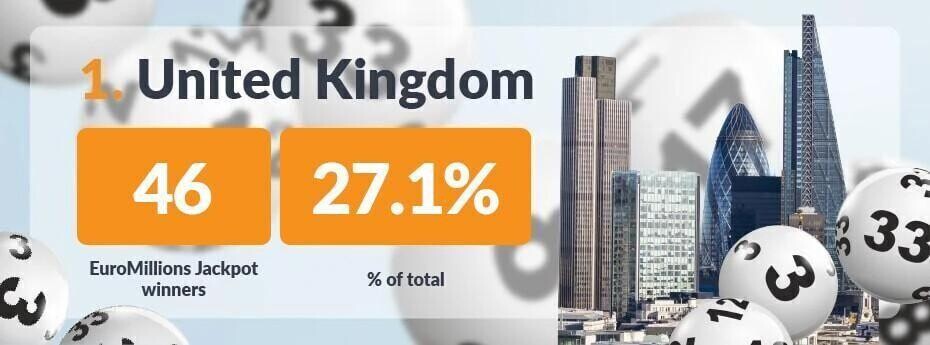
United Kingdom - 46 EuroMillions jackpot winners
The UK has the most EuroMillions jackpot winners, with 46 players snatching these jumbo prizes. This accounts for 27.1% of the total, meaning more than one in four jackpot winners is from the UK.
France has the second-highest number of EuroMillions jackpot winners with 35, equal to 20.6% of the total, while Spain follows closely behind with 33 winners.
These are the most common EuroMillions ball drawings

The most common EuroMillions number is 20 - Drawn 109 times
The most common number to be drawn in the EuroMillions is 20, having made 109 appearances since September 2016. This is closely followed by the number 23 and 21 which share second place with 104 appearances, one more than 42 in fourth with 103.
The least common EuroMillions number is 22 - Drawn 64 times
The least lucky number in the EuroMillions is 22, as it has only appeared in the draw 64 times since September 2016. It is also the only number to come up fewer than 70 times, with the number 40 making the second-fewest appearances at 71.
The most common Lucky Stars number is 3 - Drawn 176 times
The most lucky Lucky Stars number is 3 having been drawn 176 times, five more than that of 2 with 171 in second. Rounding out the top three is 6 which has been drawn a total of 157 times since September 2016.
The least common Lucky Stars number is 5 - Drawn 128 times
The least lucky Lucky Stars number is 5 having been drawn 128 times, three more than that of 1 with 131 in second. Rounding out the top three in terms of least recurring is 4 which has been drawn a total of 137 times since September 2016.
The most common EuroMillions pair is 23 and 32 - Drawn together 18 times
The most common pair of numbers to be drawn in the EuroMillions is 23 and 32, with the combo appearing 18 times since September 2016. The numbers 17 and 23 were the second most common pair, selected 17 times. This makes the number 23 seem especially lucky, featuring in the top two pairs.
The most common EuroMillions Lucky Stars pair is 2 and 8 - Drawn together 26 times
The most common pair of numbers to be drawn in the EuroMillions is 2 and 8, with the combo appearing 26 times since September 2016. The numbers 3 and 7 were the second most common pair, selected 22 times and both 6 and 7 and 2 and 10 have been drawn 21 times.
Data correct as of March 2025
Liverpool is the UK city where EuroMillions is most popular
| Rank | City | Population | EuroMillions searches | EuroMillions searches per 100,000 people |
|---|---|---|---|---|
| 1 | Liverpool | 506,552 | 636,790 | 125,711 |
| 2 | Bolton | 184,073 | 175,820 | 95,516 |
| 3 | Swansea | 170,055 | 149,600 | 87,972 |
| 4 | Manchester | 470,411 | 368,110 | 78,253 |
| 5 | Leeds | 536,321 | 415,870 | 77,541 |
| 6 | Huddersfield | 141,692 | 107,180 | 75,643 |
| 7 | Newcastle upon Tyne | 286,468 | 208,670 | 72,842 |
| 8 | Glasgow | 631,690 | 458,810 | 72,632 |
| 9 | Belfast | 293,298 | 209,140 | 71,306 |
| 10 | Edinburgh | 505,310 | 359,490 | 71,142 |
Liverpool - 125,711 EuroMillions searches per 100,000 people
Liverpool has the highest rate of EuroMillions searches in the UK, with 125,711 per 100,000 people. This makes Liverpool the only city or town in the UK where the ratio of EuroMillions searches to residents exceeds 1.
Bolton has the second-highest rate of EuroMillions searches at 95,516 per 100,000, with a total of 175,820 searches. The only other city with a rate higher than 80,000 searches per 100,000 people is Swansea, which stood at 87,972.
Thunderball
First introduced in 1999, Thunderball is a classic UK lottery that offers more chances to win and a regular jackpot of £500,000. Players choose five regular numbers from 1 to 39 and one Thunderball from 1 to 14. Tickets are just £1 per entry, with prizes starting at £3 for anyone who matches their Thunderball in the draw.

The most common number in Thunderball is 30 - Drawn 385 times
Thunderball’s most commonly drawn number is 30, appearing 385 times in the history of the draw. This is followed by the number 18, being drawn 370 times, while the number 26 took third place with 361 appearances.
The least common number in Thunderball is 9 - Drawn 317 times
The Number 9 had the lowest number of appearances, being drawn 317 times. The number 37 was the second-least drawn with 318 appearances, followed by 14 with 321.
The most common Thunderball is 13 - Drawn 218 times
The luckiest Thunderball overall has been number 13, with 218 appearances. Number 3 was the next luckiest Thunderball with 216 appearances, while Thunderball 7 took third place with 205.
The least common Thunderball is 9 - Drawn 167 times
The least commonly drawn Thunderball is number 9, with 167 appearances. This is followed by Thunderball number 6, with 176 appearances, and Thunderball number 2, which came up 178 times.
The most common pair in Thunderball is 11 and 33 and 26 and 29 - Drawn together 53 times
The luckiest numbers in Thunderball are 11 and 33 and 26 and 29, which were drawn together 53 times overall. While each of the top five pairs have all been drawn at least 50 times. 7 and 34 with 52 draws and both 28 and 38 and 2 and 32 on 51.
Liverpool is also the top city for Thunderball searches per capita
| Rank | City | Population | Thunderball searches | Thunderball searches per 100,000 people |
|---|---|---|---|---|
| 1 | Liverpool | 506,552 | 203,290 | 40,132 |
| 2 | Bolton | 184,073 | 62,430 | 33,916 |
| 3 | Huddersfield | 141,692 | 42,910 | 30,284 |
| 4 | Swansea | 170,055 | 50,570 | 29,737 |
| 5 | Wolverhampton | 234,015 | 68,830 | 29,413 |
| 6 | Leeds | 536,321 | 147,980 | 27,592 |
| 7 | Birmingham | 1,121,408 | 307,310 | 27,404 |
| 8 | Newcastle upon Tyne | 286,468 | 78,280 | 27,326 |
| 9 | Manchester | 470,411 | 125,040 | 26,581 |
| 10 | Peterborough | 190,584 | 48,030 | 25,201 |
Liverpool - 40,132 Thunderball searches per 100,000 people
The city with the most Thunderball searches in the UK is Liverpool, with 40,132 per 100,000 people. Bolton takes second place again, with a rate of 33,916 searches per 100,000 people, while Huddersfield claims third place with 30,284 searches per 100,000.
Data correct as of January 2024
Set for Life

Introduced as recently as 2019, Set for Life offers a different spin on the classic lottery formula. With draws twice a week, players choose five numbers between 1 and 47, and one Life Ball between 1 and 10. The difference with Set for Life is that the jackpot is not a lump sum cash prize, instead paying out £10,000 each month for 30 years, with the runner-up receiving this monthly sum for one year.
The top Set for Life number is 21 - Drawn 85 times
The luckiest number in Set for Life is 21, being drawn 85 since the draw's inception. This is closely followed by number 3, being drawn 80 times, while number 26 and 11 were the joint-third most common, with 79 appearances each.
The least common Set for Life number is 1 - Drawn 51 times
The number with the fewest appearances in Set for Life is 1, drawn only 51 times overall. Number 46 made the next-fewest appearances, with 54, while numbers 28 and 45 were each only drawn 55 times.
The most common Set for Life pair is 16 and 21 - Drawn together 15 times
Numbers 16 and 21 are the most common pair in Set for Life, being drawn together 15 times in the past six months. While 21 also appeares with 13 as many as 14 times - meaning a total of 29 times when paired with 13 or 16.
The most common Life Ball in Set for Life is 6 - Drawn 77 times
The luckiest Life Ball in Set for Life is number 6, which appeared 77 times overall. Two other Life Balls have made more than 70 appearances. 9 has been drawn 73 times and 3 has been drawn 72.
The least common Life Ball is 4 - Drawn 50 times
The Life Ball with the lowest draw rate is number 4, having only been selected 50 times overall. While there is a mathematically equal chance of each Life Ball being drawn, there is a sizeable difference between the most and least common numbers.
Liverpool is the UK city with the most searches for Set for Life
| Rank | City | Population | Set for Life searches | Set for Life searches per 100,000 people |
|---|---|---|---|---|
| 1 | Liverpool | 506,552 | 122,030 | 24,090 |
| 2 | Bolton | 184,073 | 35,980 | 19,547 |
| 3 | Huddersfield | 141,692 | 22,650 | 15,985 |
| 4 | Manchester | 470,411 | 73,210 | 15,563 |
| 5 | Swansea | 170,055 | 24,470 | 14,389 |
| 6 | Leeds | 536,321 | 75,260 | 14,033 |
| 7 | Newcastle upon Tyne | 286,468 | 39,400 | 13,754 |
| 8 | Wolverhampton | 234,015 | 31,750 | 13,568 |
| 9 | Birmingham | 1,121,408 | 150,690 | 13,438 |
| 10 | Peterborough | 190,584 | 24,120 | 12,656 |
Liverpool - 24,090 Set for Life searches per 100,000 people
Liverpool has the highest interest in Set for Life, with over 24,000 searches per 100,000 people. The total number of searches in the city over the past 12 months was just 122,000.
The people of Bolton made the second-highest number of searches for Set for Life in the past year, with 19,547 per 100,000, while Huddersfield saw the third-highest search rate of 15,985 per 100,000.
Health Lottery
The Health Lottery gives players the chance to support projects that benefit people’s physical and mental health in the UK. The Health Lottery has raised over £130 million to help fund over 3,500 individual projects, making a real impact on the lives of vulnerable groups in society.
There are several games to choose from in the Health Lottery, with the flagship game being The Big Win. Players simply choose five numbers from 1 to 50 to have a chance of winning the £25,000 jackpot. Draws happen four times every week and tickets cost only £1 each.

The most common number in the Health Lottery’s The Big Win is 20 - Drawn 197 times
Number 20 is the most commonly drawn in ‘The Big Win’, with 197 appearances overall. This is closely followed by number 29 and 46 both with 194 appearances each.
The least common number in The Big Win is 39 - Drawn 144 times
The least commonly drawn number in ‘The Big Win’ is 39, which appeared 144 times. Number 7 appeared the second-fewest times, with 149 appearances, followed by number 40, which appeared 154 times.
The most common pair in The Big Win is 36 and 38 - Drawn together 28 times
The most common pair in The Big Win was numbers 36 and 38, drawn together 28 times overall. Numbers 9 and 43 were the second most common pair, with 26 appearances, while numbers 29 and 32 were drawn together 25 times.
Manchester saw the highest level of interest in the Health Lottery
| Rank | City | Population | Health Lottery searches | Health Lottery searches per 100,000 people |
|---|---|---|---|---|
| 1 | Manchester | 470,411 | 13,080 | 2,781 |
| 2 | Liverpool | 506,552 | 13,770 | 2,718 |
| 3 | Swansea | 170,055 | 4,420 | 2,599 |
| 4 | Bolton | 184,073 | 4,590 | 2,494 |
| 5 | Warrington | 174,954 | 3,950 | 2,258 |
| 6 | Huddersfield | 141,692 | 2,950 | 2,082 |
| 7 | Leeds | 536,321 | 10,060 | 1,876 |
| 8 | York | 141,671 | 2,640 | 1,863 |
| 9 | Middlesbrough | 148,219 | 2,490 | 1,680 |
| 10 | Peterborough | 190,584 | 3,050 | 1,600 |
Manchester - 2,781 Health Lottery searches per 100,000 people
The people of Manchester are the most interested in the Health Lottery, with 2,781 searches per 100,000 people. Liverpool takes second place with 2,718 searches per 100,000, while Swansea came third with 2,599.
Data correct as of January 2024
Postcode Lottery
The Postcode Lottery is another popular game in the UK, this time using a subscription model to provide players with more chances to win. Signing up for the Postcode Lottery costs £12 per month, with 20 different postcodes winning every single day and minimum prizes of £1,000. Additionally, the stakes are raised each Saturday as players in one lucky postcode win a share of £1 Million in the Millionaire Street prize.
The Birmingham postcode has won the Postcode Lottery most frequently

| Rank | Postcode | Area | Wins |
|---|---|---|---|
| 1 | B | Birmingham | 1,378 |
| 2 | S | Sheffield | 1,299 |
| 3 | M | Manchester | 1,163 |
| 4 | NE | Newcastle | 1,067 |
| 5 | NG | Nottingham | 1,012 |
| 6 | G | Glasgow | 975 |
| 7 | PE | Peterborough | 851 |
| 8 | CF | Cardiff | 835 |
| 9 | PO | Portsmouth | 829 |
| 10 | SA | Swansea | 829 |
Birmingham - 1,378 Postcode Lottery win
Birmingham is the luckiest UK area for the postcode lottery, with 1,378 wins. This is followed by Sheffield, with 1,299 wins, and Manchester with 1,163
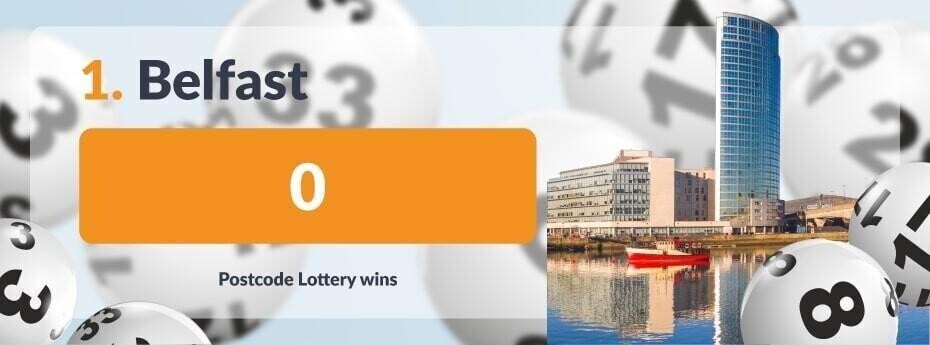
Belfast is the only UK postcode that has never won the Postcode Lottery
Belfast is the only UK postcode that has never won the Postcode Lottery
| Rank | Postcode | Area | Wins |
|---|---|---|---|
| 1 | BT | Belfast | 0 |
| 2 | WC | Western Central London | 9 |
| 3 | ZE | Zetland | 16 |
| 4 | EC | East Central London | 17 |
| 5 | HS | Outer Hebrides | 43 |
| 6 | LD | Llandrindod Wells | 51 |
| 7 | KW | Kirkwall | 56 |
| 8 | HG | Harrogate | 112 |
| 9 | HX | Halifax | 138 |
| 10 | SM | Sutton | 139 |
Belfast - 0 Postcode Lottery wins
The Belfast BT postcode is the only UK area never to win the Postcode Lottery. The next-lowest number of wins was in West Central London, with only nine wins under its belt, while the Zetland area has the third lowest with 16.
Data correct as of March 2025
Swansea saw the highest level of interest in the Postcode Lottery
| Rank | City | Population | Postcode Lottery searches | Postcode Lottery searches per 100,000 people |
|---|---|---|---|---|
| 1 | Swansea | 170,055 | 34,910 | 20,529 |
| 2 | Middlesbrough | 148,219 | 28,210 | 19,033 |
| 3 | Warrington | 174,954 | 31,620 | 18,073 |
| 4 | Huddersfield | 141,692 | 24,980 | 17,630 |
| 5 | Bolton | 184,073 | 27,840 | 15,124 |
| 6 | Liverpool | 506,552 | 74,280 | 14,664 |
| 7 | Manchester | 470,411 | 67,750 | 14,402 |
| 8 | Leeds | 536,321 | 69,760 | 13,007 |
| 9 | Peterborough | 190,584 | 23,320 | 12,236 |
| 10 | Plymouth | 266,983 | 32,360 | 12,121 |
Swansea - 20,529 Postcode Lottery searches per 100,000 people
Swansea saw the most significant public interest in the Postcode Lottery, with 20,529 searches per 100,000 people. No other area had a rate above 20,000, with second-place Middlesbrough recording 19,033 searches per 100,000 people, while Warrington took third place with 18,073.
Data correct as of January 2024
Methodology
We took the number of Lotto millionaires and £50,000+ winners from the National Lottery.
Data showing the most commonly drawn numbers and pairs, Postcode Lottery wins by area, and EuroMillions won by country were taken from lottery.co.uk.
This data is from March 2025
Search data was taken from Google Keyword Planner and normalised against City Population data. This was done for the 50 largest UK towns and cities and covered the 12-month period from February 2023 to January 2024.
The search terms analysed for each lottery were:
- how to play [LOTTERY]
- play [LOTTERY] online
- [LOTTERY]
- [LOTTERY] check numbers
- [LOTTERY] jackpot
- [LOTTERY] odds
- [LOTTERY] results
- [LOTTERY] ticket
- [LOTTERY] ticket price
- [LOTTERY] winnings
Searches for all these terms were combined for each lottery to provide a total search volume for each area.
This data is from January 2024