Horse Racing, greyhounds and snooker specialist with thirty years experience of writing about sport across multiple platforms. A QPR and Snooker fan
Framing your own betting market
There has been some good discussion on OLBG about framing personal markets for horse races, and I thought it might be worthwhile to give a basic guide on how to frame a market.
In these days of betting exchanges, I think it's becoming ever more important to know the basics of market framing.

Betting Exchanges UK - The best sites in the UK
The best betting sites will sometimes give the impression that framing a betting market is a complicated thing, and admittedly it can appear a bit daunting, with all the different fractional odds etc, and talk of percentages, over-rounds, and overlays, but framing a market is actually a very simple thing to do.
You can read more about what bookies do in the following excellent article.

How Bookmakers Work and Create Odds
Once learnt, the skill to frame your own market is an invaluable tool, and it can completely change the way you approach your betting.
I'm not going to use this blog to go into the different factors that determine the individual prices within a horse race betting market.
Ultimately that is all about personal opinion, and I don't want to create a needless debate here that would only detract from the purpose of this blog.
I will use examples that give no room to debate the prices within the markets.
The easiest markets to frame are those based on pure laws of probability.
An example would be the odds on the roulette wheel.
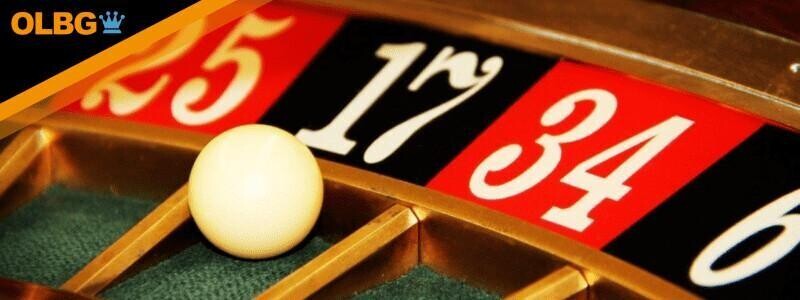
Each separate outcome has an identical chance of occurring, and so framing the market is a simple matter of allocating each outcome it's true percentage of probability and converting it to odds.
If a horse race was such an exact science though, it'd be pretty boring, for one, but it would also be impossible to win.
Framing Process
For my example, I'm not going to use a horse race.
Everybody's idea of rating each horse is different, so instead, I'll use the example of coloured balls in a bucket, and frame a market based on the odds of each coloured ball being chosen by a blind man.
I'll show how to frame a market at 100% (a true market), at 110% (a layer's, or bookmaker's market), and at 90% (a backer's market).
Hopefully, I can make it all easy to understand.
Stick with it, because it really is worthwhile and it isn't as complicated as it might seem at first.
So, we have a field of 5 colours and like a horse race each colour has a different chance of being selected because there isn't an equal number of each colour.
- 8 Red balls
- 6 Blue balls
- 5 Green balls
- 3 Brown balls
- 1 Orange ball
When rating a horse race, the usual practice is to allocate points to each runner based on whatever the oddsmaker deems important. It can be as simple as the above:
- Horse A: 8 points.
- Horse B: 6 points.
- Horse C: 5 points.
- Horse D: 3 points.
- Horse E: 1 point.
or as complex as the oddsmaker wants.
The process of converting the ratings points to odds is exactly the same though, no matter how complicated the ratings are. For example, if the number of balls in the bucket were:
- 2,556 Red balls
- 2,102 Blue balls
- 1,455 Green balls
- 600 Brown balls
- 229 Orange balls
then converting the chances of each ball being selected is exactly the same as below.
Steps And Example
Step 1:
Firstly, you need the sum of all possible outcomes. The following percentage table can be used as reference.
Odds Converter | Fractional to Decimal Odds & Probability
In this case, we have the following coloured balls (8+6+5+3+1 = 23).
Step 2:
Then, divide each selection by the sum of all outcomes, which in this case is 23.
- 8/23 = 0.348
- 6/23 = 0.261
- 5/23 = 0.217
- 3/23 = 0.130
- 1/23 = 0.043
The result is each selection's actual chance of being "successful".
Step 3:
You then convert the figures to a percentage by multiplying them by whatever percent you want your market set at.
A true market is set at 100%, so we multiply each figure by 100:
- 0.348 = 34.8%
- 0.261 = 26.1%
- 0.217 = 21.7%
- 0.130 = 13.00%
- 0.043 = 4.30%
Step 4:
To change the percentage into decimal odds just divide 100 by the percentage figure:
- 100/34.80(%) = 2.873
- 100/26.10% = 3.831
- 100/21.70% = 4.610
- 100/13.00% = 7.700
- 100/4.30%. = 23.250
To set the market at 110% you simply multiply the figures gained at Step 2 by 110 instead of 100, and to set the market at 90% just multiply by 90.
Of course, you can set the market at whatever percentage you want (usually <100% for a backers market, and >100% for a layer's market).
The table below shows the contrasting prices between a "true" market, and both a layer's and backer's market.
So, the true (100%) odds of plucking a Green coloured ball from the bucket is 4.61, or near to 7/2.
Bookmakers would offer the green ball odds of 4.19 based on their 110% market (say 13/4),
While value seekers armed with their 90% backer's market would be looking for odds of 5.12 that the green ball would win.
Value is found whenever odds are better than those in the 100% "true" market.
| Selection | True Market (100%) | Layer's Market (110%) | Backer's Market (90%) |
|---|---|---|---|
| Red | 2.873 | 2.612 | 3.192 |
| Blue | 3.831 | 3.483 | 4.26 |
| Green | 4.61 | 4.19 | 5.12 |
| Brown | 7.7 | 6.7 | 8.55 |
| Orange | 23.25 | 21.141 | 25.84 |
Chester Horse Race Example
I'd like to finish with some suggestions on rating an actual horse in a race, but that's a very subjective thing, and it's probably best left for each person to decide how to rate their own horses, or possibly it can be the subject of another blog.
I will say though that a simple, but still sometimes useful market, can be framed from very basic statistics.
Take the draw bias at Chester for example:
In 4 runner fields since 2000, the stats are:
- Stall 1: 16 Wins
- Stall 2: 15 Wins
- Stall 3: 6 Wins.
- Stall 4: 5 Wins.
That's over all the distances.
A very simple market could be framed with statistics like these.
By dividing each statistic (16, 15, 6 & 5) by the sum of all outcomes (42) you have a market that says the true odds of a runner winning from:
Stall 1 is 38%, or about 2.63 or around 13/8.
Stall 2 is 36% or about 2.77 or around 7/4
Stall 3 is 14% or about 7.14 or around 6/1
Stall 4 = 11.90% which is odds of 8.40 or around 15/2.
Slightly off track, but there is no limit to the opportunities that abound with the amount of information that's available these days.
Hopefully, this blog helps someone frame their own markets.
I'm not sure how clear I've been able to explain the process, but I'll answer any questions if anyone needs further explanation.
Please do check out the related article below.
