

Former PDC Darts Professional, SkySports Darts Commentator and YouTuber with 6 tournament wins under his belt including the Iceland Open in 2023
Dive into the precision world of darts where the 3-dart average reigns supreme as the ultimate measure of skill and consistency. Understand how players achieve staggering statistics and what it means for the evolution of this beloved sport. This article will unravel high averages and showcase how professional darts has transformed into the powerhouse it is today. It may even help you with your darts predictions in upcoming events.
The Data Behind 3 Dart Averages

The Top Darts Betting Sites 2025
High Dart Average
When it comes to statistics within the world of darts, the one that is most cited is the average. The average is considered as the barometer of a player’s form but is also hard to maintain at a high level due to the nature of the sport itself.
With a score of 501 being whittled down to 0 serving as the sport’s primary aim, it stands to reason that an average score is only going to dwindle the further two players' progress within a competitive leg.
Raise Your Game: High Checkouts for Skyrocketing 🎯 Averages!
How do the world’s best constantly rack up averages of 100 and more? The answer to that question comes in the form of hitting High checkouts earlier in the leg. Manage to achieve this and those averages can be boosted rather quickly.
While the sport of darts has certainly boosted in the past decade or so, as professionalism sweeps through the ranks and with this it also means the standards have only risen further. Some say this is the golden era of the game and those people do have a case to argue.
Darts Legends Face-Off: A Comparative Era Showdown 🎯
Of course, comparing one era to another is always folly and never quite offers the definitive answer that everyone is looking for. Was Eric Bristow better than Phil Taylor, is Michael van Gerwen more electric than the ‘Power’?
One way that the argument can be settled is by looking at the best ever averages within darts. Are the numbers getting higher as the years progress? A look at the highest televised averages will go some way to uncovering the truth.
| Date | Player | Average | Score | Opponent | Average | Tournament | Value Rank | Date Rank |
|---|---|---|---|---|---|---|---|---|
| 25 February 2016 | Michael van Gerwen | 123.4 | 7–1 | Michael Smith | 91.41 | 2016 Premier League | 1 | 16 |
| 4 June 2017 | Kim Huybrechts | 121.97 | 4–1 | Paul Lim | 100.4 | 2017 World Cup | 2 | 9 |
| 2 March 2017 | Peter Wright | 119.5 | 7–2 | Adrian Lewis | 109.15 | 2017 Premier League | 3 | 11 |
| 5 June 2010 | Phil Taylor | 118.66 | 9–0 | Kevin Painter | 82.85 | 2010 UK Open | 4 | 25 |
| 1 November 2009 | Phil Taylor | 118.14 | 10–3 | Gary Anderson | 106.12 | 2009 European Championship | 5 | 26 |
| 7 April 2016 | Michael van Gerwen | 117.95 | 7–5 | Robert Thornton | 104.23 | 2016 Premier League | 6 | 13 |
| 19 June 2022 | Gerwyn Price | 117.88 | 4–0 | Martin Schindler | 101.31 | 2022 World Cup | 7 | 3 |
| 1 March 2012 | Phil Taylor | 117.35 | 8–4 | Simon Whitlock | 105.44 | 2012 Premier League | 8 | 23 |
| 23 April 2015 | Michael van Gerwen | 116.9 | 7–0 | James Wade | 93.93 | 2015 Premier League | 9 | 17 |
| 3 March 2016 | Michael van Gerwen | 116.67 | 7–2 | Peter Wright | 108.98 | 2016 Premier League | 10 | 14 |
| 3 May 2012 | Phil Taylor | 116.1 | 8–1 | James Wade | 93.95 | 2012 Premier League | 11 | 22 |
| 23 April 2009 | Phil Taylor | 116.01 | 8–3 | John Part | 100.05 | 2009 Premier League | 12 | 29 |
| 13 April 2023 | Gerwyn Price | 115.97 | 6–2 | Chris Dobey | 103.27 | 2023 Premier League | 13 | 1 |
| 19 March 2015 | Phil Taylor | 115.8 | 4–7 | Raymond van Barneveld | 104.18 | 2015 Premier League | 14 | 19 |
| 29 October 2021 | Mervyn King | 115.62 | 6–0 | James Wade | 86.13 | 2021 World Series Finals | 15 | 6 |
| 3 June 2017 | Ronny Huybrechts | 115.62 | 4–0 | John Michael | 88.94 | 2017 World Cup | 16 | 10 |
| 7 June 2009 | Phil Taylor | 115.62 | 10–0 | Mark Lawrence | 93.9 | 2009 UK Open | 17 | 27 |
| 6 June 2009 | Phil Taylor | 115.51 | 9–3 | Ken Mather | 93.49 | 2009 UK Open | 18 | 28 |
| 25 February 2016 | Phil Taylor | 115.25 | 7–5 | Dave Chisnall | 109.63 | 2016 Premier League | 19 | 15 |
| 14 November 2021 | Michael van Gerwen | 115.19 | 5–2 | Joe Cullen | 98.33 | 2021 Grand Slam | 20 | 5 |
| 8 June 2019 | William O'Connor | 115.1 | 4–1 | Rob Cross | 106.62 | 2019 World Cup | 21 | 8 |
| 17 July 2010 | Phil Taylor | 114.99 | 10–6 | Barrie Bates | 93.2 | 2010 World Matchplay | 22 | 24 |
| 23 March 2023 | Gerwyn Price | 114.96 | 6–1 | Michael van Gerwen | 98.48 | 2023 Premier League | 23 | 2 |
| 7 March 2015 | Michael van Gerwen | 114.91 | 9–2 | Kim Huybrechts | 101.59 | 2015 UK Open | 24 | 20 |
| 16 November 2020 | Dimitri Van den Bergh | 114.85 | 5–1 | Ricky Evans | 95.8 | 2020 Grand Slam | 25 | 7 |
| 28 April 2022 | James Wade | 114.73 | 6–1 | Gerwyn Price | 99.17 | 2022 Premier League | 26 | 4 |
| 9 November 2014 | Phil Taylor | 114.65 | 5–1 | Christian Kist | 99.46 | 2014 Grand Slam | 27 | 21 |
| 7 June 2008 | Phil Taylor | 114.54 | 9–3 | Wes Newton | 97.32 | 2008 UK Open | 28 | 30 |
| 9 April 2015 | Dave Chisnall | 114.17 | 7–1 | James Wade | 87.12 | 2015 Premier League | 29 | 18 |
| 9 May 2004 | Darryl Fitton | 114.15 | 6–0 | Davy Richardson | NR | 2004 International Darts League | 30 | 31 |
| 1 January 2017 | Michael van Gerwen | 114.05 | 6–2 (S) | Raymond van Barneveld | 109.34 | 2017 PDC World Championship | 31 | 12 |
Before we take a deep dive, we must highlight that this is not an exhaustive list of high dart averages. The cutoff for the table is that the finish must be televised and also be over 114.00. Now that criteria has been selected, let’s look through the 31 winning averages.
Top of the pile is Michael Van Gerwen who landed an incredible 123.40 average at the expense of Michael Smith in the 2016 Premier League. Not only is it the highest televised average, but it is also 1.43 higher than the next entry on the list.
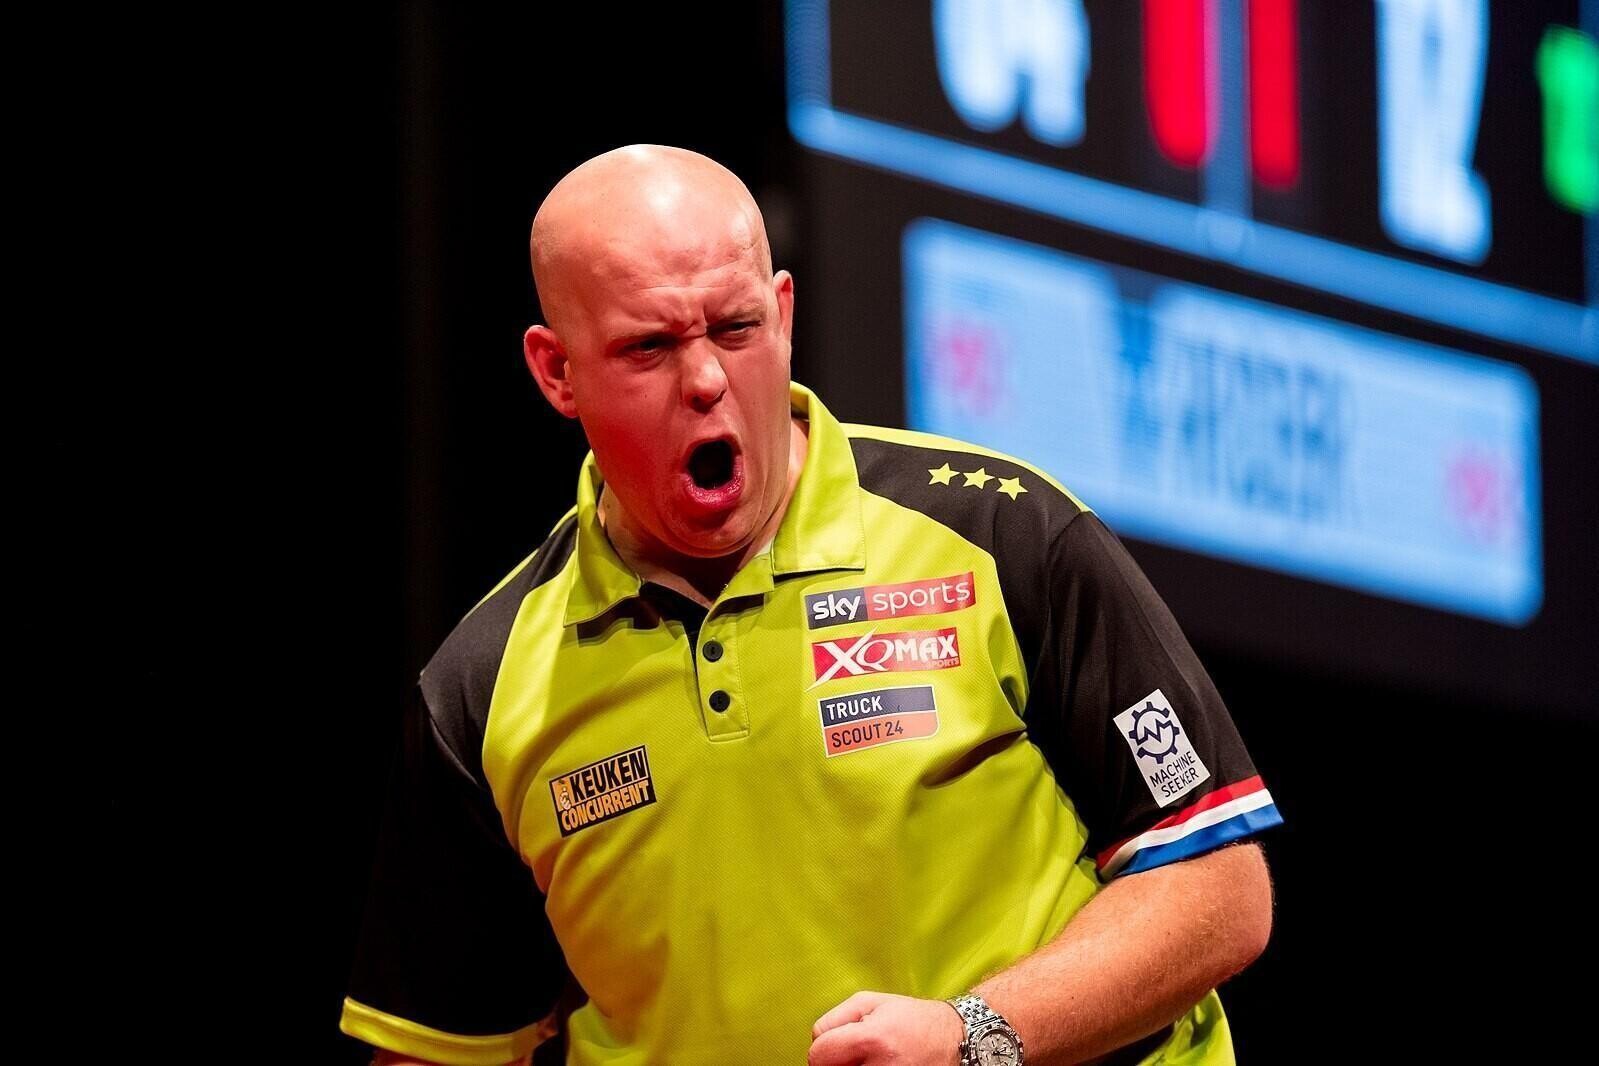 Michael van gerwen possess the highest televised average
Sven Mandel, CC BY-SA 4.0 , via Wikimedia Commons
Just two of the 31 averages in question have surpassed 120 or more – van Gerwen as mentioned above and also Kim Huybrechts effort a year later in the 2017 World Cup of Darts. Huybrechts flew the flag for Belgium in June of that year, he also recorded a 121.97 average for the match with Paul Lim.
Earlier that same year Peter Wright and his multi-coloured hair scheme managed to record 119.50 over Adrian Lewis. As a consequence, the man known as ‘Snakebite’ managed the second-highest average that the Darts Premier League has ever seen.
While the most recent additions to the list have come courtesy of Gerwyn Price, the former World Champion landed a 117.88 in the 2022 World Cup and a 115.97 in this year’s edition of the Premier League.
Van Gerwen, Huybrechts & Snakebite Wright Lead the Charge!
In our list of 31 averages, Price ranks 13th and 23rd and when it comes to recency bias, there is nothing in the way of saying that the most recent additions are the top averages in the list, but what if we used this same list and placed it date order:
| Date | Player | Average | Score | Opponent | Average | Tournament | Date Rank |
|---|---|---|---|---|---|---|---|
| 9 May 2004 | Darryl Fitton | 114.15 | 6–0 | Davy Richardson | NR | 2004 International Darts League | 16 |
| 7 June 2008 | Phil Taylor | 114.54 | 9–3 | Wes Newton | 97.32 | 2008 UK Open | 9 |
| 23 April 2009 | Phil Taylor | 116.01 | 8–3 | John Part | 100.05 | 2009 Premier League | 11 |
| 6 June 2009 | Phil Taylor | 115.51 | 9–3 | Ken Mather | 93.49 | 2009 UK Open | 25 |
| 7 June 2009 | Phil Taylor | 115.62 | 10–0 | Mark Lawrence | 93.9 | 2009 UK Open | 26 |
| 1 November 2009 | Phil Taylor | 118.14 | 10–3 | Gary Anderson | 106.12 | 2009 European Championship | 13 |
| 5 June 2010 | Phil Taylor | 118.66 | 9–0 | Kevin Painter | 82.85 | 2010 UK Open | 3 |
| 17 July 2010 | Phil Taylor | 114.99 | 10–6 | Barrie Bates | 93.2 | 2010 World Matchplay | 23 |
| 1 March 2012 | Phil Taylor | 117.35 | 8–4 | Simon Whitlock | 105.44 | 2012 Premier League | 17 |
| 3 May 2012 | Phil Taylor | 116.1 | 8–1 | James Wade | 93.95 | 2012 Premier League | 14 |
| 9 November 2014 | Phil Taylor | 114.65 | 5–1 | Christian Kist | 99.46 | 2014 Grand Slam | 22 |
| 7 March 2015 | Michael van Gerwen | 114.91 | 9–2 | Kim Huybrechts | 101.59 | 2015 UK Open | 29 |
| 19 March 2015 | Phil Taylor | 115.8 | 4–7 | Raymond van Barneveld | 104.18 | 2015 Premier League | 1 |
| 9 April 2015 | Dave Chisnall | 114.17 | 7–1 | James Wade | 87.12 | 2015 Premier League | 19 |
| 23 April 2015 | Michael van Gerwen | 116.9 | 7–0 | James Wade | 93.93 | 2015 Premier League | 6 |
| 25 February 2016 | Michael van Gerwen | 123.4 | 7–1 | Michael Smith | 91.41 | 2016 Premier League | 10 |
| 25 February 2016 | Phil Taylor | 115.25 | 7–5 | Dave Chisnall | 109.63 | 2016 Premier League | 27 |
| 3 March 2016 | Michael van Gerwen | 116.67 | 7–2 | Peter Wright | 108.98 | 2016 Premier League | 28 |
| 7 April 2016 | Michael van Gerwen | 117.95 | 7–5 | Robert Thornton | 104.23 | 2016 Premier League | 15 |
| 1 January 2017 | Michael van Gerwen | 114.05 | 6–2 (S) | Raymond van Barneveld | 109.34 | 2017 PDC World Championship | 5 |
| 2 March 2017 | Peter Wright | 119.5 | 7–2 | Adrian Lewis | 109.15 | 2017 Premier League | 8 |
| 3 June 2017 | Ronny Huybrechts | 115.62 | 4–0 | John Michael | 88.94 | 2017 World Cup | 24 |
| 4 June 2017 | Kim Huybrechts | 121.97 | 4–1 | Paul Lim | 100.4 | 2017 World Cup | 2 |
| 8 June 2019 | William O'Connor | 115.1 | 4–1 | Rob Cross | 106.62 | 2019 World Cup | 20 |
| 16 November 2020 | Dimitri Van den Bergh | 114.85 | 5–1 | Ricky Evans | 95.8 | 2020 Grand Slam | 7 |
| 29 October 2021 | Mervyn King | 115.62 | 6–0 | James Wade | 86.13 | 2021 World Series Finals | 4 |
| 14 November 2021 | Michael van Gerwen | 115.19 | 5–2 | Joe Cullen | 98.33 | 2021 Grand Slam | 21 |
| 28 April 2022 | James Wade | 114.73 | 6–1 | Gerwyn Price | 99.17 | 2022 Premier League | 30 |
| 19 June 2022 | Gerwyn Price | 117.88 | 4–0 | Martin Schindler | 101.31 | 2022 World Cup | 18 |
| 23 March 2023 | Gerwyn Price | 114.96 | 6–1 | Michael van Gerwen | 98.48 | 2023 Premier League | 31 |
| 13 April 2023 | Gerwyn Price | 115.97 | 6–2 | Chris Dobey | 103.27 | 2023 Premier League | 12 |
With the list now placed in date order, we can see that Darryl Fitton’s entry was the one steeped in the most history, as his 114.15 was recorded in the 2004 edition of the International Darts League. In addition to this, it also ranks 30th out of the 31 overall high averages.
You then had to wait for four years for Phil Taylor to make his first entry on the list, not only that but it was the first of 10 consecutive entries. If you wanted high averages between June 2008 and November 2014, then the 16-time World Champion was your man.
Darts Legends Set the Stage: Fitton & Taylor's Averages Mark the Rise of Dart Mastery 📊🎯
However, there is something of note when it comes to both Fitton’s average of 2004 and Taylor’s of 2008 and this their overall placing in our list of 31. 30th and 28th respectively suggest that standards have improved in the year’s since.
Not a direct correlation but the start of one all the same and if it were to be a direct correlation, you would have the oldest of the 31 averages being at the bottom of overall list and the newest of them being at the top.
As you can see though, the list has not mapped out like that and to give this some more context, we will now add in the date order rank against the value rank:
| Date | Player | Average | Tournament | Value Rank | Date Rank | Difference | 0.0841476506 |
|---|---|---|---|---|---|---|---|
| 25 February 2016 | Michael van Gerwen | 123.4 | 2016 Premier League | 1 | 16 | -15 | |
| 4 June 2017 | Kim Huybrechts | 121.97 | 2017 World Cup | 2 | 9 | -7 | |
| 2 March 2017 | Peter Wright | 119.5 | 2017 Premier League | 3 | 11 | -8 | |
| 5 June 2010 | Phil Taylor | 118.66 | 2010 UK Open | 4 | 25 | -21 | |
| 1 November 2009 | Phil Taylor | 118.14 | 2009 European Championship | 5 | 26 | -21 | |
| 7 April 2016 | Michael van Gerwen | 117.95 | 2016 Premier League | 6 | 13 | -7 | |
| 19 June 2022 | Gerwyn Price | 117.88 | 2022 World Cup | 7 | 3 | 4 | |
| 1 March 2012 | Phil Taylor | 117.35 | 2012 Premier League | 8 | 23 | -15 | |
| 23 April 2015 | Michael van Gerwen | 116.9 | 2015 Premier League | 9 | 17 | -8 | |
| 3 March 2016 | Michael van Gerwen | 116.67 | 2016 Premier League | 10 | 14 | -4 | |
| 3 May 2012 | Phil Taylor | 116.1 | 2012 Premier League | 11 | 22 | -11 | |
| 23 April 2009 | Phil Taylor | 116.01 | 2009 Premier League | 12 | 29 | -17 | |
| 13 April 2023 | Gerwyn Price | 115.97 | 2023 Premier League | 13 | 1 | 12 | |
| 19 March 2015 | Phil Taylor | 115.8 | 2015 Premier League | 14 | 19 | -5 | |
| 29 October 2021 | Mervyn King | 115.62 | 2021 World Series Finals | 15 | 6 | 9 | |
| 3 June 2017 | Ronny Huybrechts | 115.62 | 2017 World Cup | 16 | 10 | 6 | |
| 7 June 2009 | Phil Taylor | 115.62 | 2009 UK Open | 17 | 27 | -10 | |
| 6 June 2009 | Phil Taylor | 115.51 | 2009 UK Open | 18 | 28 | -10 | |
| 25 February 2016 | Phil Taylor | 115.25 | 2016 Premier League | 19 | 15 | 4 | |
| 14 November 2021 | Michael van Gerwen | 115.19 | 2021 Grand Slam | 20 | 5 | 15 | |
| 8 June 2019 | William O'Connor | 115.1 | 2019 World Cup | 21 | 8 | 13 | |
| 17 July 2010 | Phil Taylor | 114.99 | 2010 World Matchplay | 22 | 24 | -2 | |
| 23 March 2023 | Gerwyn Price | 114.96 | 2023 Premier League | 23 | 2 | 21 | |
| 7 March 2015 | Michael van Gerwen | 114.91 | 2015 UK Open | 24 | 20 | 4 | |
| 16 November 2020 | Dimitri Van den Bergh | 114.85 | 2020 Grand Slam | 25 | 7 | 18 | |
| 28 April 2022 | James Wade | 114.73 | 2022 Premier League | 26 | 4 | 22 | |
| 9 November 2014 | Phil Taylor | 114.65 | 2014 Grand Slam | 27 | 21 | 6 | |
| 7 June 2008 | Phil Taylor | 114.54 | 2008 UK Open | 28 | 30 | -2 | |
| 9 April 2015 | Dave Chisnall | 114.17 | 2015 Premier League | 29 | 18 | 11 | |
| 9 May 2004 | Darryl Fitton | 114.15 | 2004 International Darts League | 30 | 31 | -1 | |
| 1 January 2017 | Michael van Gerwen | 114.05 | 2017 PDC World Championship | 31 | 12 | 19 |
If the correlation was perfect than the respective values in the difference column would all be 0. However, you can see that this is not the case and the differences vary far and wide, therefore there is no genuine correlation between the recency of a high average and the overall value.
For example, Michael van Gerwen’s table topping 123.40 was only the 16th most recent in the list, a difference of 15 places worse off. While Kim Huybrechts’ 121.97 may have ranked second numerically but was only ninth when it came to date order.
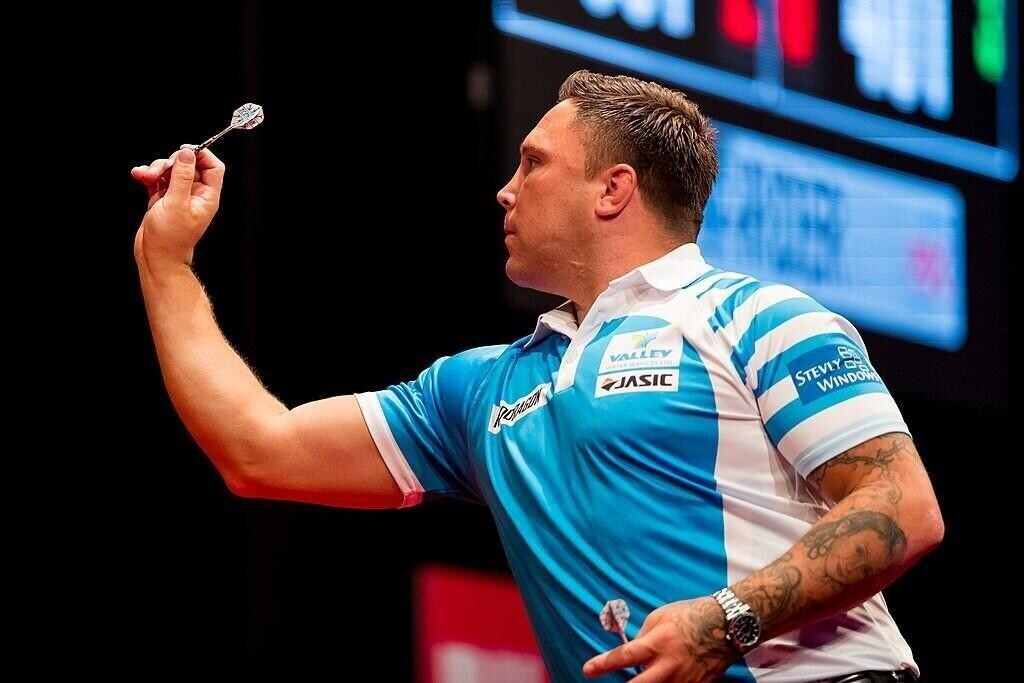 Gerwyn Price -
Sven Mandel, CC BY-SA 4.0
On the other hand, Gerwyn Price’s most recent addition to the list, is only 13th when it comes to numerical order. Once again proving that something being short in the memory is not a guarantee of being top of the list.
If were to try and put a numerical figure on the correlation between the value rank and the date rank columns, the overall figure would be 0.0841476506. To add further context to this, the laws of numerical correlation are as follows:
- A correlation coefficient of +1 indicates a perfect positive correlation
- A correlation coefficient of -1 indicates a perfect negative correlation
- A correlation coefficient near 0 indicates no correlation.
With the figure being 0.08, it shows that there is no correlation between the value and date ranks of this high average finishes. However, we can also apply a wider framework to this and although these 31 averages may not match, it does show that the last 19 years has seen a step change in value.
With Daryl Fitton’s 2004 entry of 114.15 being the most historic of our 31 averages, it suggests that performance from the turn of the millennium has improved from the decade before. These may be a list of televised averages but none of them occurred in the 1990’s.
Of course, there were still World Championships being played in the 1990’s and the best way to equalise all this data is by looking at the averages that have been recorded in each of the PDC World Championships since its inception in 199
PDC World Championships Averages
| Year | Champion | Final Average | Score | Runner-up (average in final) | Final Average |
|---|---|---|---|---|---|
| 1994 | Dennis Priestley | 94.38 | 6–1 | Phil Taylor | 85.62 |
| 1995 | Phil Taylor | 94.11 | 6–2 | Rod Harrington | 87.15 |
| 1996 | Phil Taylor | 98.52 | 6–4 | Dennis Priestley | 101.48 |
| 1997 | Phil Taylor | 100.92 | 6–3 | Dennis Priestley | 96.78 |
| 1998 | Phil Taylor | 103.98 | 6–0 | Dennis Priestley | 90.75 |
| 1999 | Phil Taylor | 97.11 | 6–2 | Peter Manley | 93.63 |
| 2000 | Phil Taylor | 94.42 | 7–3 | Dennis Priestley | 91.8 |
| 2001 | Phil Taylor | 107.46 | 7–0 | John Part | 92.58 |
| 2002 | Phil Taylor | 98.47 | 7–0 | Peter Manley | 91.35 |
| 2003 | John Part | 96.87 | 7–6 | Phil Taylor | 99.98 |
| 2004 | Phil Taylor | 96.03 | 7–6 | Kevin Painter | 90.48 |
| 2005 | Phil Taylor | 96.14 | 7–4 | Mark Dudbridge | 90.66 |
| 2006 | Phil Taylor | 106.74 | 7–0 | Peter Manley | 91.72 |
| 2007 | Raymond van Barneveld | 100.93 | 7–6 | Phil Taylor | 100.86 |
| 2008 | John Part | 92.86 | 7–2 | Kirk Shepherd | 85.1 |
| 2009 | Phil Taylor | 110.94 | 7–1 | Raymond van Barneveld | 101.18 |
| 2010 | Phil Taylor | 104.38 | 7–3 | Simon Whitlock | 100.51 |
| 2011 | Adrian Lewis | 99.4 | 7–5 | Gary Anderson | 99.41 |
| 2012 | Adrian Lewis | 93.06 | 7–3 | Andy Hamilton | 90.83 |
| 2013 | Phil Taylor | 103.04 | 7–4 | Michael van Gerwen | 100.66 |
| 2014 | Michael van Gerwen | 100.1 | 7–4 | Peter Wright | 95.71 |
| 2015 | Gary Anderson | 97.68 | 7–6 | Phil Taylor | 100.69 |
| 2016 | Gary Anderson | 99.26 | 7–5 | Adrian Lewis | 100.23 |
| 2017 | Michael van Gerwen | 107.79 | 7–3 | Gary Anderson | 104.93 |
| 2018 | Rob Cross | 107.67 | 7–2 | Phil Taylor | 102.26 |
| 2019 | Michael van Gerwen | 102.21 | 7–3 | Michael Smith | 95.29 |
| 2020 | Peter Wright | 102.79 | 7–3 | Michael van Gerwen | 102.88 |
| 2021 | Gerwyn Price | 100.08 | 7–3 | Gary Anderson | 94.25 |
| 2022 | Peter Wright | 98.34 | 7–5 | Michael Smith | 99.22 |
| 2023 | Michael Smith | 100.71 | 7–4 | Michael van Gerwen | 99.58 |
If we take the first 10 World Darts Championship finals from 1994 to 2003, we can see that only three of them exceeded a winning final average of 100 or more. Those years were 1997, 1998 and 2001, the man in question for all three was Phil Taylor.
Admittedly his efforts in 1997 only just tipped over 100, a year later it was a whisker away from a winning average of 104. However, the game had certainly changed by the time he won his seventh consecutive PDC crown in 2001.
The Power of Averages: Phil Taylor's Unsurpassed Darts Dominance 🎯🥇
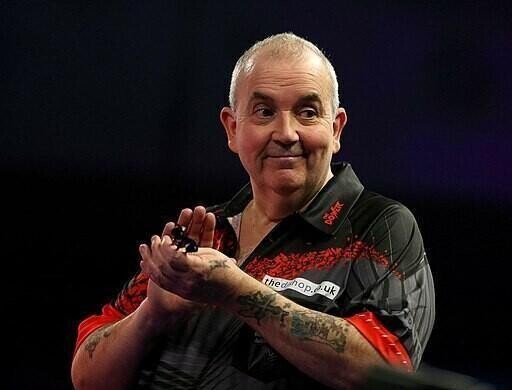 The Legendary Phil Taylor
Dartsman0003, CC BY-SA 4.0
Between Dennis Priestley’s title in 1994 and Taylor’s six in a row from 1995 to 2000, the average of the averages was 97.63, by 2001 that had risen to as high 107.46 – the highest winning average at that point and would take eight years to beat it.
Who beat Taylor’s record, none other than Taylor himself in 2009. A stunning 110.94 over long time foe Raymond van Barneveld would not have put him far from the original table of 31 televised averages, it is still the highest in a final some 14 years later.
There have been 30 PDC World Championships to date, if we put the winning final averages in order, it would look like this:
| Year | Champion | Final Average | Category |
|---|---|---|---|
| 2009 | Phil Taylor | 110.94 | Post-2008 |
| 2017 | Michael van Gerwen | 107.79 | Post-2008 |
| 2018 | Rob Cross | 107.67 | Post-2008 |
| 2001 | Phil Taylor | 107.46 | Pre-2009 |
| 2006 | Phil Taylor | 106.74 | Pre-2009 |
| 2010 | Phil Taylor | 104.38 | Post-2008 |
| 1998 | Phil Taylor | 103.98 | Pre-2009 |
| 2013 | Phil Taylor | 103.04 | Post-2008 |
| 2020 | Peter Wright | 102.79 | Post-2008 |
| 2019 | Michael van Gerwen | 102.21 | Post-2008 |
| 2007 | Raymond van Barneveld | 100.93 | Pre-2009 |
| 1997 | Phil Taylor | 100.92 | Pre-2009 |
| 2023 | Michael Smith | 100.71 | Post-2008 |
| 2014 | Michael van Gerwen | 100.10 | Post-2008 |
| 2021 | Gerwyn Price | 100.08 | Post-2008 |
| 2011 | Adrian Lewis | 99.40 | Post-2008 |
| 2016 | Gary Anderson | 99.26 | Post-2008 |
| 1996 | Phil Taylor | 98.52 | Pre-2009 |
| 2002 | Phil Taylor | 98.47 | Pre-2009 |
| 2022 | Peter Wright | 98.34 | Post-2008 |
| 2015 | Gary Anderson | 97.68 | Post-2008 |
| 1999 | Phil Taylor | 97.11 | Pre-2009 |
| 2003 | John Part | 96.87 | Pre-2009 |
| 2005 | Phil Taylor | 96.14 | Pre-2009 |
| 2004 | Phil Taylor | 96.03 | Pre-2009 |
| 2000 | Phil Taylor | 94.42 | Pre-2009 |
| 1994 | Dennis Priestley | 94.38 | Pre-2009 |
| 1995 | Phil Taylor | 94.11 | Pre-2009 |
| 2012 | Adrian Lewis | 93.06 | Post-2008 |
| 2008 | John Part | 92.86 | Pre-2009 |
In a rather neat piece of symmetry, 15 of the winners averaged over 100 in the final, the other 15 averaged under. We can also split those 30 into two different categories:
- Pre-2009 – All World Championships from 1994 to 2008
- Post-2008 – All World Championships from 2009 to 2023
If we also use these categories to see if there has been a shift in time in the past 15 years, we can also see that 10 of the top 15 final winning averages have occurred in the Post-2008 category, only five were in the Pre-2009.
This would indicate that those who have won the World Championship since 2009 have definitely had to raise their game. The top three highest winning final averages are in the Post-2008 category, along with Phil Taylor’s effort in 2009, Michael van Gerwen and Rob Cross rank for 2017 and 2018.
You could also look at this from a purely Phil Taylor perspective, of his 14 PDC World Championships, seven of those ranked in the top 15 of winning averages, the other seven ranked in the bottom 15. Once again offering some more symmetry, but did he get better as the years progressed?
Of the seven winning averages that were ranked in the top 15, three were in the Post-2008 category and four were in the Pre-2009 category. Here you could argue that he was more powerful in the first half of his title winning run.
But that argument would be blown out of the water when you look at the remaining seven World Championship wins that are left. Each of the seven were in the Pre-2009 category and therefore, this suggests that his talents actually improved with age.
Taylor getting better as the years go by, but could the same be said when it comes to the advent of professionalism? The way to measure this is by also looking at the BDO World Championship finals that took place before 199
BDO Championships Averages
| Year | Champion | Final Average | Score | Runner-Up | Final Average | Winning Status |
|---|---|---|---|---|---|---|
| 1978 | Leighton Rees | 92.40 | 11 – 7 legs | John Lowe | 89.40 | Less Than PDC |
| 1979 | John Lowe | 87.42 | 5 – 0 sets | Leighton Rees | 76.62 | Less Than PDC |
| 1980 | Eric Bristow | 88.10 | 5 – 3 | Bobby George | 86.49 | Less Than PDC |
| 1981 | Eric Bristow | 86.10 | 5 – 3 | John Lowe | 81.00 | Less Than PDC |
| 1982 | Jocky Wilson | 88.10 | 5 – 3 | John Lowe | 84.30 | Less Than PDC |
| 1983 | Keith Deller | 90.00 | 6 – 5 | Eric Bristow | 93.90 | Less Than PDC |
| 1984 | Eric Bristow | 97.50 | 7 – 1 | Dave Whitcombe | 90.60 | PDC Level |
| 1985 | Eric Bristow | 97.50 | 6 – 2 | John Lowe | 93.12 | PDC Level |
| 1986 | Eric Bristow | 94.47 | 6 – 0 | Dave Whitcombe | 90.45 | PDC Level |
| 1987 | John Lowe | 90.63 | 6 – 4 | Eric Bristow | 94.29 | Less Than PDC |
| 1988 | Bob Anderson | 92.70 | 6 – 4 | John Lowe | 92.07 | Less Than PDC |
| 1989 | Jocky Wilson | 94.32 | 6 – 4 | Eric Bristow | 90.66 | PDC Level |
| 1990 | Phil Taylor | 97.47 | 6 – 1 | Eric Bristow | 93.00 | PDC Level |
| 1991 | Dennis Priestley | 92.57 | 6 – 0 | Eric Bristow | 84.15 | Less Than PDC |
| 1992 | Phil Taylor | 97.58 | 6 – 5 | Mike Gregory | 94.42 | PDC Level |
| 1993 | John Lowe | 83.97 | 6 – 3 | Alan Warriner | 82.32 | Less Than PDC |
To get an ideal measure from the BDO World Championships we have introduced a cutoff point of 1993. Although there were additional finals from 1994 to 2020, the PDC split occurred in 1994 and we are treating this as a natural point of comparison.
Now that the line in the sand has been drawn, we also need to take the lowest scoring PDC winning average of 92.86 by John Part in 2008 and use that as the benchmark for all the BDO finals from 1978 to 1993.
Using that benchmark, we can see that the first six BDO World Championships were less than 92.40 and are considered as Less Than PDC quality. In total, this occurs on 10 of 16 possible occasions – only six winning BDO averages were at the same level of PDC quality.
Unsurprisingly it was Phil Taylor who was responsible for two of them as he earned the first two of his 16 overall World Championships. Three of the remaining four were courtesy of the ‘Crafty Cockney’ Eric Bristow.
It is clear to see that Taylor was PDC class as he won 14 additional titles under their governance, Bristow may not have added to his tally of crowns under the BDO but he was definitely worthy of mixing it with the newly created elite.
Then again, even the evolution of Bristow himself was rather interesting. The first two of his BDO World Championship wins saw him recorded final averages of 88.10 and 86.10 in 1980 and 1981 respectively, the treble of wins between 1984 and 1986 saw nothing lower than 94.47.
While the final step will be to plot these six ‘PDC Level’ averages into the list of PDC winning averages and see exactly where they lie:
| Year | Champion | Final Average | Category |
|---|---|---|---|
| 2009 | Phil Taylor | 110.94 | Post-2008 |
| 2017 | Michael van Gerwen | 107.79 | Post-2008 |
| 2018 | Rob Cross | 107.67 | Post-2008 |
| 2001 | Phil Taylor | 107.46 | Pre-2009 |
| 2006 | Phil Taylor | 106.74 | Pre-2009 |
| 2010 | Phil Taylor | 104.38 | Post-2008 |
| 1998 | Phil Taylor | 103.98 | Pre-2009 |
| 2013 | Phil Taylor | 103.04 | Post-2008 |
| 2020 | Peter Wright | 102.79 | Post-2008 |
| 2019 | Michael van Gerwen | 102.21 | Post-2008 |
| 2007 | Raymond van Barneveld | 100.93 | Pre-2009 |
| 1997 | Phil Taylor | 100.92 | Pre-2009 |
| 2023 | Michael Smith | 100.71 | Post-2008 |
| 2014 | Michael van Gerwen | 100.10 | Post-2008 |
| 2021 | Gerwyn Price | 100.08 | Post-2008 |
| 2011 | Adrian Lewis | 99.40 | Post-2008 |
| 2016 | Gary Anderson | 99.26 | Post-2008 |
| 1996 | Phil Taylor | 98.52 | Pre-2009 |
| 2002 | Phil Taylor | 98.47 | Pre-2009 |
| 2022 | Peter Wright | 98.34 | Post-2008 |
| 2015 | Gary Anderson | 97.68 | Post-2008 |
| 1992 | Phil Taylor | 97.58 | BDO |
| 1984 | Eric Bristow | 97.50 | BDO |
| 1985 | Eric Bristow | 97.50 | BDO |
| 1990 | Phil Taylor | 97.47 | BDO |
| 1999 | Phil Taylor | 97.11 | Pre-2009 |
| 2003 | John Part | 96.87 | Pre-2009 |
| 2005 | Phil Taylor | 96.14 | Pre-2009 |
| 2004 | Phil Taylor | 96.03 | Pre-2009 |
| 1986 | Eric Bristow | 94.47 | BDO |
| 2000 | Phil Taylor | 94.42 | Pre-2009 |
| 1994 | Dennis Priestley | 94.38 | Pre-2009 |
| 1989 | Jocky Wilson | 94.32 | BDO |
| 1995 | Phil Taylor | 94.11 | Pre-2009 |
| 2012 | Adrian Lewis | 93.06 | Post-2008 |
| 2008 | John Part | 92.86 | Pre-2009 |
As you can see there is a neat cluster of BDO winning averages that sit 22nd to 25th in this newly adjoined list. The first 100+ winning average from Gerwyn Price in 2021 finds itself in 15th place by comparison.
In addition to this, Eric Bristow’s 94.47 winning average from 1986 sits 30th out of 36 entries and the last of the BDO winners to make the list is Jocky Wilson. The Scot won the crown in 1989, he did so with a 94.32 average – a rank of 33 from 36.
This means there has certainly been an evolution in the sport since the acrimonious breakaway of the PDC in 1994. The BDO may have been the forefathers of a pursuit that is played by many but now the pursuit is to record even higher averages on the way to outright glory.
Contributor and Data Source Information
We wanted to look deep into the 3 darts averages of the top players and in top events over the years, so who better to turn to that Darts professional Matt Edgar and our very own data scientist Dan Tracey

Data and Words
Dan Tracey is a multi-talented writer, data analyst and podcaster whose six-year career in the sports data sphere has seen incredible successes. From helping UEFA create their annual technical reports to writing articles for Sports Betting Websites including sites like TheLinesUS and Goal - there's no shortage of areas where his expertise shines through! In addition, he can be heard on podcasts lending an insightful voice as well as providing weekly betting angles - all culminating with him teaming up OLBG.com in the present day. Simply put: wherever you find angled data being crunched? You'll also likely find Dan not far behind!
👨🏫 Specialist Subjects🔬📚
Dan's specialist area is data; and lots of it! Wherever we need numbers to create our unique deep dive articles, Dan is our go-to. Dan is also a Tottenham Fan and a football commentator for Newcastle Blue Star
OLBG Sponsored Darts Professional
Matthew Edgar, born on August 28, 1986, is an English professional darts player currently targeting the WDF World championships at Lakeside in December 2024 and commentating on Darts for Sky Sports. Known for his practice sessions with former world championship runner-up Kevin Painter, Edgar began his sports career as a coach for Northampton Town before shifting to darts. Prior to his darts career, he trained in mixed martial arts and was a professional wrestler. Edgar also hosts a dedicated darts YouTube channel, "Edgar TV," where he interacts with followers and shares his professional competition experiences.
Follow Matthew as he targets Lakeside and the WDF World Championships in December 2024.
Source:
https://en.wikipedia.org/wiki/High_dart_average
https://en.wikipedia.org/wiki/BDO_World_Darts_Championship
https://en.wikipedia.org/wiki/PDC_World_Darts_Championship
Data correct as of 26th October 2023
More Darts Content at OLBG
We have a wide selection of darts content on OLBG from the best betting sites for darts to specific event previews and data content, as well as a darts betting guide.

Darts TV Ratings - The Growth of Darts Viewing Figures

Revealing a Dart Player’s Income: Millionaire Luxury or Modest Living?
The Average 3 Dart Score of the Top 32 PDC Darts Players

PDC World Darts Championship Betting Tips Guide

Striking Perfection: The Legacy of Televised Nine-Dart Finishes