Many people bet based on headlines or hunches. I dig into research and market moves behind political odds & manager markets, so you can back decisions, not guesses.
Using Statistics In Betting
Have you ever wondered how experts consistently make successful bets?

Many use statistics and trends to guide their betting life.
Tipsters use statistics when explaining why they are backing a selection in the OLBG Tips Competition.
This comprehensive guide dives deep into this topic, shedding light on how you can leverage these tools to maximize your betting success.
By reading this, you can jump start your journey to becoming a better punter or even a professional bettor.
Uncover Betting Secrets: Leverage Statistics & Trends
Introduction to Statistics
Statistics are a scientific branch of mathematics and is the study of collecting, analysing and interpreting data.
In the 21st century, sports betting stats are now playing even more of a crucial role in our betting - and having these stats to hand gives all of us a much better chance when taking on the odds compilers from the best betting sites.
When betting, you analyse statistical data to make informed bets on the sporting event of your choice.
You can research a range of statistics + identify trends enabling you to profit.

There is no magic bullet, but the bookmakers use them, and what is good for them is good for us.
Now you can make a bet without statistics but if you want long term success you need the stats.
Different Types Of Statistics
Every sporting and subsequent betting event comes with statistics. You can be overwhelmed by the sheer number of stats, so it is essential to be aware of all but filter those that do not directly influence your bet.
You can track longer-term statistics such as Football Home and Away form, Horse Racing Trainer performance over a season, or Cricket batting averages over the last month.
The bookmakers on their websites supply some basic statistics, but you may need to visit specialist providers to delve more deeply, and there could be a cost involved for their stats.
On OLBG, we focus on the major sports that members like to bet on. Every major horse race in the UK features on the OLBG blog pages.
Sussex National Preview, Tips, Runners and Trends.
Every racecourse has its own individual page where you can gather pertinent stats.
The football blogging section features thousands of articles, all created to assist betting decisions.
The importance of using statistics and trends when betting
Information as we know is power, you are taking on the bookmakers when placing a bet or taking on other punters when trading on a betting exchanges such as Betfair or Smarkets, why would you not do everything you can to win?
- Statistics let you test a hypothesis.
- Statistics allow you to understand and solve a problem.
- Statistics let you see trends from teams or groups that would have been impossible to fathom if you did not have the data.
- Statistics enable you to adopt or change a specific betting strategy.
- Keeping statistical records can alert you to unplanned bets guided by the figures.

- Statistics can help you decide to leave a race or match alone or indicate that the event is ripe for your betting funds.
- Statistics can indicate how much to wager on a particular event or outcome.
- Statistics can help you compare and contrast teams, players, and races.
- Statistics can sway your decision on which team is the better value.
Ultimately, statistics guide your crucial decision-making, enabling you to increase and protect your betting bank.
Understanding statistics in betting
The probability of an event and the odds of that event happening can be more easily fathomed when you use statistics.
You need to make key betting decisions and the stats will assist your understanding of an event.

We know from other betting school lessons that value in betting is the key to long term profitability.
Statistics help you understand if a win or a defeat was by chance or statistically that the “surprise” result was more likely to happen anyway.
Different types of stats bettors can track
Below are some of the most popular stats that bettors use for three sports Football, Horse Racing and the NFL.
| Football Teams | Football Players | Horse Racing | NFL |
|---|---|---|---|
| Conceded | Appearances | All Weather or Grass Record | Downs |
| Disciplinary | Assists | Beaten favourite | Interceptions |
| Draws | Clean Sheets | Blinkers/Headgear | Kicking |
| Goals | Disciplinary | Chase or Hurdles Record | Passing |
| Head to Head | Fouls | Claiming Jockey | Punting |
| Home v Away | Goals | Course & Distance | Receiving |
| Losses | Saves | Days Since Last Run | Returning |
| Points | Shots | Grade of Race | Rushing |
| Scored | Tackles | Jockey Win Percentage | Sacks |
| Wins | xG | Long Distance Traveller | Tackles |
| xG | Market Mover | Total Yards | |
| Official Rating | Touchdowns | ||
| Trainer Win Percentage | Turnovers | ||
| Weight Carried | Yards Allowed | ||
| Wind Operation |
Here are the EPL results from 2019 - 2023.
| Result | 2023/24 | 2022/23 | 2021/22 | 2020/21 | 2019/20 | 2018/19 |
|---|---|---|---|---|---|---|
| EPL Home | 48% | 43% | 38% | 45% | 48% | |
| EPL Draws | 23% | 23% | 22% | 24% | 19% | |
| EPL Away | 29% | 34% | 40% | 31% | 34% |
These historical percentages need to be considered when you are placing your single bets or for many of you when you add multiple teams in an accumulator or bet builder.
Understanding Trends in Betting
What are betting trends and why they matter?
Trends as opposed to mathematical statistics are patterns within your researched information that lead in this instance to a betting conclusion.
It could be a no-bet conclusion but the trend will be your guide.
How to identify and interpret trends?
The figures and statistics when collected can now be explored to discover trends.
You can create graphs, tables, charts, heat maps, histograms, which will enable you to see the trends (if any) in the numbers.

Examples of trending betting strategies
A trainer that has a great strike rate when he sends his horses more than 200 miles on a Sunday and books a claiming jockey as opposed to his stable jockey.
A team that plays a completely different defensive system when on the road as opposed to when it is at home.
A coach whose first thought at all of his 4 managerial appointments has been to always play out from the goalkeeper, a risky strategy against the top teams where he is yet to register a win.
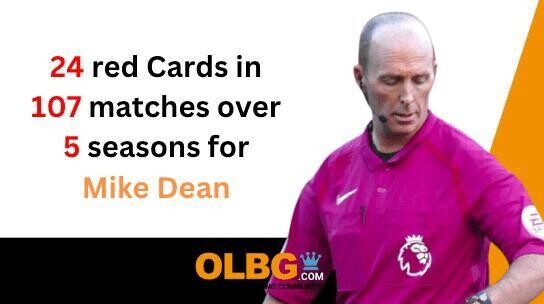
Referees with new PGMOL (Professional Game Match Officials Limited) guidelines that are being interpreted less/more severely than was intended which has quickly resulted in less/ more/ yellow cards
For example do outright horse racing favourites win more often on certain days of the week?
| Day | 2021 | 2022 | 2023 | Average |
|---|---|---|---|---|
| Monday | 36.7% | 36.8% | 34.9% | 36.13% |
| Tuesday | 36.3% | 36.6% | 32.8% | 35.23% |
| Wednesday | 34.7% | 36.1% | 36.3% | 35.70% |
| Thursday | 33.4% | 36.2% | 35.0% | 34.87% |
| Friday | 33.5% | 33.1% | 32.0% | 32.87% |
| Saturday | 35.2% | 34.1% | 32.6% | 33.97% |
| Sunday | 34.9% | 35.4% | 38.8% | 36.37% |
How to use statistics and trends effectively
You can obviously merge your collected statistics and researched trends to reach an understanding or you may be alerted to a trend and they check the stats behind the trend.
You can start with either but you are looking for a correlation between the two.
So let's say the trend for odds on EPL teams winning games is upwards
2018 :61%
2019: 62%
2020: 63%
2021’ 64%
2022: 65%
2023: 65%
You then look at the stats for the four odds on teams this weekend and discover that of those four teams Tottenham have won all of their last six games when on the road, whether they were odds on or not.
So the EPL Odds On Trend is going in your favour + the recent Tottenham away from home statistics are very strong.
In this instance you have merged trends with stats.
Case studies on how statistics can lead to successful bets
Speed Figures
Most of us over estimate the chances of Willie Mullins winners at the Cheltenham Festival.

A member advised laying the Master of Closutton horses that were priced between certain odds.
Mullins stats for the last four years at Prestbury Park were as follows,.
| Year | Wins | Runners |
| 2020 | 7 | 56 |
| 2021 | 6 | 55 |
| 2022 | 10 | 63 |
| 2023 | 6 | 76 |
OLBG Expert Andy Powell
1000 Guineas
1000 Guineas Preview
Common mistakes to avoid
All of us have preconceived thoughts, these will be early ideas of how we think the event will pan out.
You already have a mental image of how the match or race will unfold. You may advise your friends to follow you.
As an example you may believe that the best UK Horses can compete at the Cheltenham Festival with the best of the Irish Runners.

This is where the trends show how wrong your initial thoughts would be, for UK trainers the results are getting worse.
The Prestbury Cup is a competition between the two countries trainers to see who can win the most races over the four days.
| Year | UK Winners At Cheltenham Festival | Irish Winners At Cheltenham Festival |
|---|---|---|
| 2024 | 9 | 18 |
| 2023 | 10 | 18 |
| 2022 | 10 | 18 |
| 2021 | 5 | 23 |
| 2020 | 10 | 17 |
| 2019 | 14 | 14 |
| 2018 | 11 | 17 |
| 2017 | 9 | 19 |
| 2016 | 13 | 15 |
| 2015 | 14 | 13 |
| 2014 | 15 | 12 |
| Total | 111 | 166 |
Because the Irish trainers are doing so well they may attract even wealthier owners with even deeper pockets who can purchase the best horses.
This set of results may then become an ongoing upward trend.
The Ante post favourite for the Paddy Power Stayers Hurdle in 2024 is the French-trained Theleme; he has that lofty position in the betting because he beat another French horse, the ultra-impressive Il Est Francais.
However, of the 27 (non-UK or Irish) horses that have run at the Cheltenham Festival since only one has tasted victory (Easyland in 2020).
The stats and trends are all against Theleme!

Stayers Hurdle Preview, Tips, Runners & Trends (Cheltenham Festival)
Rule Changes
When an event or sport changes its rules naturally the statistics can be affected.
- NHL: Shoot Outs Introduced
- Football: Goal Line Technology
- Basketball: Three Point Line
- Football: VAR
With the introduction of VAR we can see the impact it has had on
Offside decisions
Late goals
Extra minutes
Bookings for time wasting.
As a follower of trends and stats you need to be aware of how changes can skew the figures after the rule was introduced.
A very simple change such as the increase in teams and games for a tournament naturally increases the figures that are returned.

The World Cup expanded from 32 matches in Mexico 1970 to 64 matches in France 1998.
- Mexico 1970 - 32 Matches
- West Germany 1974 - 38 Matches
- Spain 1982 - 52 Matches
- France 1998 - 64 Matches
The 2026 tournament to be played in North America will feature a record breaking 80 matches!
The 2026 FIFA World Cup Group Stages
World Cup Flops
Statistical Blogs
Many of the articles and blogs that feature on OLBG will be heavy with statistics. It enables the writer to define a system or explain the workings behind a strategy.

Grand National Preview, Tips, Runners & Trends (Grand National Meeting)
Cheltenham Gold Cup Preview, Tips, Runners & Trends (Cheltenham Festival)
Football Betting Using Statistics
Big Bash League Betting Preview
Australian Open Tennis Preview, Trends & Analysis
Place Your Best Bet on Strictly Come Dancing
There are even statistics on your and other gamblers behaviour!

The OLBG Gambling Study 2023
Sports Betting Modeling
Statistics and data can eventually lead to successfully building a sports betting model.
Here, you specify a sports betting opportunity you would like to build a model for; it could be anything.
Google sheets or Excel data can be used to model.
You use this model to estimate probabilities and outcomes leading to you placing value bets with the leading bookmakers.
Harry Kane Scoring Record
As a simple example you know that Harry Kane in the last eight seasons has scored on average 20 goals a season,

He averages 13 goals throughout the season at home, 7 away from home.
On average 4 of these were headers, 3 of which came in the second half.
As we reach the second half of the season he has only managed eight goals all have been at home and none have been headers.
The model will alert you to the chance he has of scoring in their next game against bottom of the table Leeds United at Elland Road.
You then decide if the odds on offer are in your favour based on the models percentage chance of success.
When the odds are in your favour head over to the bookmaker promotions page where you can see the list of free bets currently available from all UK betting sites.
Inside Information
Statistics are not needed is if the bettor has inside information on an up coming event.

- Horse Racing Trainers who let their owners know that the previously poor horse is going very well at home and is likely to win this race.
- Football insiders who know a player is going to sign for their club.
- Courtsiders who have been secretly told that the odds on tennis player has an injury.
- Boxing punters who know that the odds on ageing champion is going to announce his retirement after this hastily arranged bout.
- Spot fixing in cricket.
Conclusion
Statistics can:
- Inform our decision making.
- Give us a quicker recognition of patterns within the stats
- Allow us to have better betting bank management
- Enable us to keep accurate records
- Give us a clearer view of the betting market
- Give us a better understanding of the match or race
- Enhance our winnings.
As innovations are launched we will see lots of changes in the world of betting and on how we use and access data, with the cost of this information expected to fall.

The next few years will see many technological advances, all will have a part to play in our betting lives.
- AI analytics
- Algorithm-driven statistics
- Augmented Reality
- Cryptocurrency
- In Play Expansion into more sports.
- Mobile Statistics
- Regulation and Legislation
- Virtual Reality.
Your ability to interpret all the new data and trends may be the difference between winning and losing.
Just remember the odds need to be in our favour whatever the stats say!

FAQ
FAQ
Statistics FAQ
Back Fit
This is the practice of selecting results that fit your claim and excluding those that don't.
E.g. "Arsenal will win based on their recent performance record."
Justification: Arsenal are unbeaten in 5 games (two winning cup games against non league teams and three poor home draws).
Ignored: Prior to this Arsenal lost both games (3-0, 2-0) against their main EPL rivals.
What is the Gamblers Fallacy?
The mistaken belief that because something has happened more frequently than usual, it's now less likely to occur in the future and vice versa.
What is Sampling Bias?
Drawing conclusions from a set of data that isn't representative.
Causation or Correlation?
Causation means one thing causes another.
Correlation is simply a relationship where action A relates to action B, but the one event doesn't necessarily cause the other event to happen.
Should I Use Graphs?
Using Graphs, Bar lines, Histograms, Pie charts, etc will give you a visual interpretation of your researched statistics. The creator and the audience will be able to better understand the data and reach a conclusion, often with more clarity.
What Is Randomness Bias?
It is when you see patterns in the data but the results can be put down to randomness.
Responsible Gambling
Whether you are all over the statistics or not, responsible gambling is a must. The following article is packed with helpful links, + gives you the tools to keep your gambling in check.

Responsible Gambling Features, Function and Help
Editorial Information
This statistics article is the result of input from OLBG members over a long period of time, with detailed contributions from the OLBG Betting Experts.
The article was formatted and edited by NIgel Skinner.


