

With hundreds of different betting sites, finding the best can be confusing. I'll guide you through and find the most suitable bookie for you.
What is a Betting System?
Whether you are a betting novice or a seasoned expert, our comprehensive guide on betting systems has got you covered.
We expose the light and the dark side of these systems to enable your profitable journey in the betting world.
Not only do we empower you with understanding good systems, but we also help you dodge those that could harm.
Discover the Secrets of Betting Systems
What is a betting system? - A betting system is a set of rules that define a systematic process to finding a betting selection.
This differs from betting strategy or a staking system for betting.
Betting systems have been popular with gamblers for as long as betting has been in existence.
This article will focus on betting systems and staking systems for sports betting.
You can find Casino betting systems in the comprehensive Casino Guides section of the website.
A betting strategy is the overall process of making bets and as such systems make up just a part of a strategy.
Warning About Betting Systems
- No betting system for sale is going to work long term.
- No betting system that you discover yourself is going to work forever
- There is no betting system that can beat a casino long term
- The betting systems that work, you will never find the details of.
Now, with that off my chest, let's have a chat about betting systems, because, as a betting systems enthusiast with over 25 years of experience, I feel I am well placed to say that betting systems, despite the above, are still fun, challenging, rewarding and can bring in profits for a short period of time.

Betting Systems That Work
The caveat to this section is these systems work if you pick the right races and the right selections, which still requires an element of skill, and is not 100% systematic selection picking. however, the rules narrow down the possibilities of picking the wrong selections sufficiently to give them the System name
Place Laying System (Horse Racing)
This system requires you to have a Betting Exchange Account - best betting exchanges
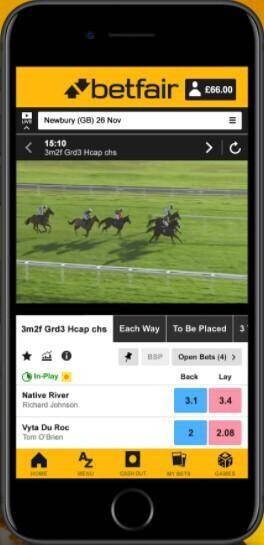
This system requires you to find a race with between 5-7 runners this is important as this system is taking advantage of only 2 places being paid in the race.
You are looking for runners who are very lowly priced, preferably under 2.80 combined.
EG Runner 1 priced 1.25 to place, Runner 2 priced 1.50 to place in the first 2
Here you would place a LAY bet on each of the two runners to not finish in the first 2 places.
Let's use £100 stakes as an example:
- Runner 1 - £100 laid at 1.25 odds
- Runner 2 - £100 laid at 1.50 odds
Here are the possible outcomes and the profit or loss
- If both runners place, the liability is £25 on Runner 1 and a further £50 on runner two meaning a loss of £75
- If Runner 1 is unplaced but Runner 2 finishes in the first two, You win £100 for Runner 1 and lose £50 on Runner 2
- If Runner 2 is unplaced but Runner 1 finishes in the first two, You win £100 for Runner 2 and lose £25 on Runner 1
- If both runners are unplaced you win £100 for each
The table below includes an exchange commission deduction of 5%
| Both Runners Place | Runner 1 Unplaced | Runner 2 Unplaced | Both Unplaced |
|---|---|---|---|
| -£75 | +£47.50 | £+71.25 | +£190.00 |
So you can see, to make a loss, both runners that you have opposed would have to fill the first two places in the race.
Whilst they will most likely be the first and second favourites to do so, it remains a bet that is likely to succeed at a frequency sufficient to offset the occasional loss.
Depending on how big a risk you want to take, the combined prices of the two runners, and therefore the total liability to set is up to you, but I would not recommend having a liability of more than £100 in this example. If you can keep it below £100, the better.
Here is another example of the possible outcomes, if the liability is raised to £100
Runner 1 - £100 laid at 1.40
Runner 2 - £100 laid at 1.60
| Both Runners Place | Runner 1 Unplaced | Runner 2 Unplaced | Both Unplaced |
|---|---|---|---|
| -£100 | +£38.00 | +£57.00 | +£190.00 |
Returns are reduced on the outcome if just one of the two being out of the places, whilst the loss is greater if both find the first two positions. All the while the maximum profit does not increase.
The chances are relative of course if looking at the odds solely, so this is why I like to try to keep the bet to around a maximum liability of under £100 at these stakes
These opportunities do not come along all the time. there are only a limited number of races with between 5-7 runners available in the UK and not every race will offer two runners at low enough odds to be able to keep under the maximum liability level.
It is not a get rich quick horse racing system but will provide slowly building profits over time.
Trainers to Follow System (Horse Racing)
This is a system born on the blog pages of OLBG from one of the longest-standing members he like to follow trainers across both flat and jumps racing depending on previous records in previous years of the same month.
The record for this system is something to behold, with consistently winning month after month, and profitable year-long records to boot.

OLBG member Scratville spends inordinate amounts of time analysing previous years record by trainer to see which have a tendency to record great results in the same month each year.
Those that show a constancy leads Scratville to believe that certain trainer have better months each year and perhaps even target certain time frames in which to get the yard to full fitness and run up impressive monthly records.
For more information, historical record and current performance, take a look at his horse racing trainers to follow blogs.
An example would be looking at January National Hunt racing and the record of trainer Sue Smith
- 2014 10/40 25% +£27.28
- 2015 8/32 25% +£31.25
- 2016 4/22 18% +£ 7.00
- 2017 7/26 27% +£11.00
- 2018 9/39 23% +£0.70
- 2019 8/19 42% +£41.25
When finding a consistent record year after year in the month of January like this, he marks down followers to bet each and every runner from that stable for the month.
You can expect to find anything up to 12 yards to keep an eye on in the trainers to follow horse racing system
Hold Up Horses over a Mile System
What about a horse racing system where horses that finished in a place but failed to win after being held up in the last 2 outings?
Some considerable research went into this to find a profitable horse racing betting system
Selection Criteria
- Follow runners in 7f & 8f races that were held up but finished 2rd or 3rd in either of their last two outings over any trip.
- Follow runners in 5f to 8f races in class 5 & 6 races that were held up but finished 2rd or 3rd in either of their last two outings over any trip.
- Follow runners in 5f to 8f races that were held up but finished 2rd or 3rd in either of their last two outings over any trip and last ran under 40 days prior.
Betting Systems That Work for a Short While
Finding a betting system that works is not hard at all, finding one that works for long enough to make a good profit before it stops being profitable is much harder.

Most systems that are publicly shared will have a short lifetime thanks to the betting markets catching up with the edge that the system has over the odds thus nullifying its profitability, but there are still a few that will provide a profit over time consistently.
In this section I will look at:
- Arbitrage Betting
- Matched Betting
- Value Betting
- Consecutive Winner Systems
Arbitrage Betting
I won't go fully into the details of how arbitrage betting works, or what you need to do to undertake the process. I will outline, however, that every punter consistently arbing will need to find odds on an event with a couple of bookmakers where the parity n the prices will allow you to bet on both possible outcomes and thanks to the odds gain a small profit regardless of the outcome.
This does work and still works, but bookmakers know when they are offering the best odds for an event and an outcome. If you consistently use a bookmaker to only get the best odds, this will be noticed and eventually, you will either have your account restricted or most likely closed due a 'trading team' decision.
For more information on arbitrage betting and which is the best account to use, take a look at the best bookmakers for Arbing article.
Matched Betting
Matched betting systems have been all the rage for a couple of years now and whilst they work in the short term, long term that unsustainable thanks to restrictions placed on punters by the bookmakers whose free bet offers are taken advantage of to make the small profits.
Matched betting involves 'arbing' and 'trading' using more than one bookmaker account to make small profits on bets using improved prices, free bets and promotions offered by bookmakers to attract new customers.

So, matched betting systems do work, but they have a finite life, as you can only use a welcome bonus with a bookmaker just once, and continued use of promotions only will find your account being restricted to not qualifying for promotions from the operator.
You will be able to operate matched betting for a time, but as with all good things, this will not last forever.
Value Betting
Value betting is simply when you are betting at better odds than the true probability dictates. Imagine if you were offered odds of 2.50 on a toss of a coin, against the true probability of around 2.00 -
Over time, you could not help but win consistently. If you can find value bets for each and every wager you make, you will be onto a winning system.
The trick is finding that value on a consistent basis.
There are a lot of member trying systems and documenting the selection process and recording results.
The Executioner is a long term member and often has a value betting systems on the go.

Consecutive Winner Systems
This is based on accumulator betting, but rather than making the bet a true accumulator, this system is built with single bets, with the full amount reinvested on the next, or in some cases a portion of the returns from the previous bet banked and the remainder reinvested, so as to build a cushion of profit, for when the ultimate loser comes along.
Many punters have tried to turn a small amount of money into a large amount of money by continually rolling winnings on to perceived certainties.
This would involve starting with a bank of something like £50 and placing it on a 1/10 shot each time for a selected amount of bets, each time playing up the total bank.
It may seem like this would take years to make realistic returns but even after 50 winning bets you’d have already made £5,869 and if you were able to find 100 winning bets at 1/10 in a row you’d win over £689,000!
This is much harder than it sounds though even if you are picking 1/10 shots.
More 1/10 shots get turned over than you’d think which is why 50 1/10 shots combined produce cumulative odds of 117/1, the chances of doing this are the equivalent of picking one 117/1 shot and it winning.

Betting Systems That Don't Work
Where do we start? There are hundreds, if not thousands of betting systems that do not work for every one you can find that does. Here are some of my favourites.
2nd Favourite System in Horse Racing
For some reason, this is a system that so many people try even though the warnings are many.
Betting level stakes on 2nd favourites will send you to the poor house quicker than betting solely on favourite or even 3rd favourites believe it or not.
For some reason the value in a second favourite in a horse race seems to be just about the worst it can be, maybe by design?

Possibly, punters do like to oppose favourites often, but by the same token do not want to go to far down the betting market understanding that the probability of finding a winner becomes harder and harder. So they settle for the second favourite in the market.
Betting on Beaten Favourites
This is another one. There may well be justifiable reasons why a favourite was beaten last time out, and will have a better chance in the next race, but this is something that can not be decided upon, simply on the last result. The race in which the horse running this time may be a very different prospect, length, ground conditions, number of runner, or a host of other possible variables stacking the odds against it's chances.
This is another system, that will not work and doesn't need any fact checking to prove
Martingale System
What is the Martingale System? - The Martingale System is a staking strategy for betting most frequently used for roulette wagers in casinos but is also often applied to sports bets at evens odds. It dictates a doubling of the stake value until a win is achieved which results in a profit of 1 x the original stake. It is both one of the most berated betting systems in the betting world and quite possibly one of the most frequently used.
Martingale Betting Experiment
For all intents and purposes, "Martingale" is nothing more than a loss-chasing exercise, with such a deep pitfall that often once a punter falls on the wrong side of it, they find themselves in a position they are unable to escape from. This will be for one of two reasons. Either they can not get a bet matched at the stake needed to recoup, or, and more often than not, funds have run down to a point where they have nothing left to stake.

To show just how dangerous this system is, man o bong covered martingale betting in one of his blogs and demonstrated how a run of 9 consecutive losers left required stakes of over £10,000 to get the £10 profit.
In another example, a member tried Martingale for a while, and after lots of bets, almost blew his entire bank.
The Kelly Criterion
Most bettors will want to know - Is the Kelly Criterion any good?- Does the Kelly Criterion work?
The gambling fraternity picked it up and it has become a staking system, particularly for horse racing.
Investors also use it to manage their plans and portfolios.
There are two basic components to the Kelly Criterion
The first is attributing probability to a positive outcome of a selected bet, and the second is a win-loss calculation.
The sum of positive trade amounts is divided by the sum of negative trade amounts.
This is Kelly's Equation
Kelly % = W-[(1-W)/R]
Where:
W = Winning Probability
R = Win/loss ratio
The output is the Kelly percentage.
Kelly's system can be put to use by following these simple steps
Check your betting records (you do have them, don't you?), and look at your last 50 bets.
You can do this by asking your broker or checking your recent tax returns (if you claimed all your trades).
If you want to apply the staking to a selection system you have, check back on previous results. By using Kelly in this way, you can see it benefits in most cases, or indeed, if it is a better staking system than a level staking plan.
Calculate "W", the winning probability.
Take this as your general strike rate over the 50 bets
Calculate "R," in this instance we are talking your ROI, return on investment.
So, your profit over the period divided by the total amount staked is multiplied by 100%, and the positive percentage figure is provided.
This does actually work with negative numbers too to minimise losses, so don't worry about testing this on losing systems either; it may just turn them around in the future without having to look at the selection process.
Input these numbers into Kelly's equation: K% = W-[(1-W)/R].
Record the Kelly percentage that the equation returns.
The equation's percentage (a number less than one) represents the portion of your bank you should stake.
For example, if the Kelly percentage is 0.05, you should stake 5% of your bank in the selection.
Be sensible with this; however, it is not automatic.
One thing to consider, regardless of what the Kelly percentage may tell you, is to commit no more than the total percentage of your bank that you wish to put at risk.
For some, that might be just 5%; others may want to use a higher percentage, say 20% if they are using a very low-odds, high-probability bet.
If you believe every bet you make is commonly termed as "value", you can gain bigger odds than the probability you think the selection is.
In the long term, Kelly should help with your bank management. However, if your judgment on this perceived value is way out of date, it will not help. It only manages your staking; it doesn't guarantee no losses!
The rule here is that Kelly Criterion will only help you manage your bank in what many people consider an efficient way: maximising profits and minimising losses.
If that aspect is looked after, the rest should be easy, huh?
Try it out, paper trade it first, or apply the staking to your last 50 recorded bets and see if it would have helped you win more or lose less.
Betting systems that used to work but don't any more.
The problem with systems usually is they are the exploitation of when the market is wrong. or at least the profitability of the system, is based on the odds available.
Often a system strike rate will not decrease but profits will, and analysis of the betting records will show that the market has moved and the odds have changed to undermine the previous profitability of the system.
Betting Systems Based on Tipsters
I will advise against buying selections from a service claiming to be providing bets from a systematic process, as in my experience with betting systems, this is just about the worst variable you can add to a system to stop it working.
This is not the same as buying tips from a tipster, That's a different thing and again whilst not an advocate of paying for tips, there are some worthwhile investments to be made in the sphere.
I won't go on to explain where to find them, you will have to undertake the research yourself, but the fact remains, buying betting systems is counterproductive to the systems long term viability.
OLBG Tips System
There have been many attempts at making betting systems based on the huge pool of tips and tipsters available on OLBG.
Get The Tips
There have been numerous systems built on OLBG Tipsters Tips.
Some have been shared and worked, others have failed. But what you do have is a pool of the best free tipsters available to choose from.
OLBG Tips offer so much information in terms of the profitability of tipsters, their full records, recent form and more.
If you choose the best betting tips page, they are all collated so you can access only the strongest tips from the most consistently profitable tipsters from a huge pool of experts for that sport.
What is the Best Betting System?
Arguably the best betting system is to be both backing and laying bets to ensure a profit regardless of the outcome of the event you are betting on. Although this falls more into 'strategy' rather than 'System'
There are a couple of ways of doing this.
- Trading
- Arbitrage Betting
Trading
There are some well-known trading systems that will practice, patience and growing skill can help make a systematic strategy to betting on sports. Again, this is not specifically a betting system in terms of a strict set of rules to make selections to bet on but could be termed as a system for betting for profit.
'Scalping' is not a new concept but one that has been used in financial trading, as well as sports betting, trading. To 'Scalp' you will need knowledge of how to lay bets like a bookmaker. We have a full laying on the exchanges guide which will help you move a step closer to trading as a system for betting.
'Arbing'
Both of these systems are ostensibly the same. With Arbitrage betting, you are looking for a disparity in the betting odds across different bookmakers so that you can place bets on different outcomes in the same market at odds that determine a profit will be made one on of the bets that will outstrip the loss on the other.
Arbitrage betting is very specialised, requires high stakes to make a low percentage of profits. It is fraught with danger and a high-risk strategy. For more about Arbitrage betting. You will need to have the best bookies for this process.
Read Now
Is there a simple backing system that works for sports betting?
The chances that the details of those systems would ever be shared are slim. It would be counterproductive to share the selections. It would result in the same horses, teams or bets being made by greater numbers of punters.
The weight of betting money for the selections would cause the betting odds to change, thus taking away the value of the bet as per the system, and overall detriment to the profitability of it.
Betting Exchange [Trading] Systems
There are a lot of profitable betting exchange systems. These can be classes in various ways
- Betting Systems
- Laying Systems
- Trading Systems
- Staking Systems
There is a great deal of crossover between all of these listed above, so lets try to make things a little more clear.
Betting exchanges may not be the most simple things to understand when you first come across them. perhaps you have switched to online betting after your local betting shop closed.
Most online bookmakers look very simple and are easy to understand. And between the 80 or so online bookies available, they all look pretty similar.
Things change when you come across betting exchange, the platform is very different and can be quite confusing at first glance.
I haven't go into betting exchanges here, but you can check which is the best betting exchange for beginners in the very helpful betting exchange comparison page.
How to Create and Develop a Betting System
For me, this is the fun part of Betting Systems. Coming up with an original idea, and testing it out.
It will take a long time, many hours in fact, and you may find you have discovered a dud, but the thrill when you think you have found something that will work, is unrivalled.
There are a huge number of angles you can take on developing your system depending on which sport you wish to build a betting system for.
Ideas for developing a horse racing system
The best advice I can give for creating a horse racing betting system is to keep it as simple as possible with as few variables as you can manage.
Creating a horse racing system with more than 6 variables to check has a couple of downfalls
- It will take a long time to check for qualifiers
- The number of qualifying bets may not be numerous enough to be able to test it over a long period of time.
Start with very obvious ideas, something that is easy to check daily

Perhaps choose only one specific length of the race, and with a maximum number of runners. You can then scan the racecards, and find that one a busy day, you will still only have just a few races to then look at.
- Races over 5-6f
- Maximum of 9 runners
From there, maybe choose just 2 variables for the runners
- Ignore races where there is an Odds-On Favourite
- Must have a previous course win
- Must have finished in the 1st three last time out after being held up
This system will throw up only a few races per day at most and will lessen still further if there are any short-priced favourites. From there You only have to check if a runner has previously won at the course and finished in the first three places last time out with the comment 'held up' in the race notes.
This would take only a few minutes a day to find the qualifiers, and would maybe throw up only a maximum of 3 qualifiers per day.
If the system has multiple qualifiers in a race, then they should all be considered for the system.
By the way, if anyone puts this to the test and it proves profitable, please contact me for my cut!!
Ideas for developing a football betting system

Football systems are easy to create and test. As with the horse racing betting systems ideas above, keep it simple and the qualifying criteria to a minumum.
You may want to bet against a team winning that has had a run of consecutive wins - That winning run has to come to an end sometime right?
Perhaps, look at how many goals a team scores at home when playing other teams in the bottom half of the table, and if it averages more than 2, then bet them to score 2 or more goals in the game.
You imagination is your only limitation when it comes to football - The stats for teams are available in their thousands and very accessible.
Pick a few ideas, find some selections and paper trade them to see how they get on.
How Many Bets is a Good Base to decide if a system is good or not?
It is good practice if possible to check back for 1000 results, and even better practice to paper trade for 100 results. This would give you a good guide as to not only the historical performance of the system but a good base of current numbers too.
You could go back and check the results of several weeks, month, years even.
If a system has been good for 4 weeks, that's not bad, but it might be that over the past 12 weeks, it was profitable only in five and four of those came in the last 4 weeks.
If you can find a system that provides many months, or even years of profitability when backtested, there is a good chance you have a good base to your system.

How to Test a Betting System
Testing a system backwards offers some information of value, but it is only past results and as we know they do not hold any guarantee for future results at all.
So the best way to test anew system is by undertaking 'paper trading'

What is Paper Trading?
The phrase paper trading comes from the financial trading markets. It means that the practice of trading can be undertaking by simulating real trading [or system betting] without the liability of loss. Records made of every action taken and the virtual profit or loss are analysed to find angles and to fine-tune the system before committing real money and risk.
It is essential to Paper Trade any new system that you discover or build to remove any risk when checking its validity.
Will I Miss Winners?
Undoubtedly you will, but I've always said I would rather miss betting a winner than bet a loser. At this stage of your relationship with the system, you have no idea how things will go. You will be able to validate the system and begin betting when you are sure the risk is low.
Betting Systems for Sale
Just dont.
No! Really. Don't buy a betting system for sale.
As explained in this article, any betting system that is extensively shared can not work in the long term and the greater number of bets being placed on the selections the system dictates, the lower the prices will become and lower the profitability of the system.
OLBG Betting Tips
Whilst it is OK to buy tips from tipping services [although not recommended], buying betting system selections is fundamentally flawed.
For one, if it is a great fool-proof betting system, it should pay enough in profits so as not need to be sold. One could argue that any sales of subscriptions helps the owner lower his own liability and improve return on investment on betting activity, but this really own works for premium tipsters and not for systems for sale.
The Betting System that won Millions
Many horse racing systems in this day and age are developed tested and selection coughed up by a computer.
A winning system is still an elusive product or at least a winning system that will make anyone rich.
However, in the early 2000's there was an American who used computers to beat horse racing and win one of the biggest racing jackpots of $16m in Hong Kong and never claimed the prize.
For Bill Benter the thrill was not in the money but the ability to make the mathematical prediction that won the jackpot
Betting Systems Software
It is possible to buy Horse Racing systems software.
A word of warning here, generally these packages are simply databases, whereby you can select a range of variable and run them through past results to find patterns, trends, or profitable betting angles.
The biggest danger here is that because you can play around with these variables, and often see results for each, you can begin to trim and specify angles based on past results, to make the system more and more narrow and profitable based on things that have happened in the past.
The more this is done, it is called back fitting, the more coincidental the results tend to be - Anyway, again, I have used just about every horse racing database available on the market, from Dataform, ProForm, and many more, and each has their own merits.
Firstly as fabulous form books that make the form, you find on the website and things like the racing post look like child play they are very much worth the investment of the monthly or annual subscriptions, and I would recommend them all.
Indeed, once you use the form analysis in one of these packages, you may feel you are blind when looking at At The Races form cards in the future so be warned.
The systematic element of these packages should be viewed as fun, first and foremost.
I for one, have become lost for hours, ney, DAYS, in playing around with the variables, ideas and inspirations in trying to find winning horse racing systematic selection process, and I can tell you that, I have found a great deal of them.

What I will also say, is that they never seem to be as profitable as the past results would suggest (see Above), and those profits, do not last long as the markets even out over time and the prices of the selections tend to get lower and lower until the strike rate is not sufficient to produce a profit over time.
More OLBG Members Thoughts on Systems
OLBG Members' Thoughts On Systems
Many members summarised some of the shortfalls with systems in numerous blog replys on OLBG.com:
The trouble with systems is that there are plenty of unknowns which can affect a system selection i.e team selection, injury news and the weather.
You can not factor in these unknowns into these systems so it makes it very difficult to blindly follow a selection.
However, what systems can do is highlight are likely outcomes.
If you can use these selections to narrow down the games you want to bet on you can then research the games and the info at hand and make a decision on whether to make those bets.
Man O Bong also has his take on systems which is a very interesting read for anyone seriously into their systems click here to check out Man O Bong's opinions about systems.
Bespoke Systems
There are millions of other systems that punters have created for their own needs and we can't list them all.
In team sports these systems can be anything, ranging from laying any team that is missing four or more regular first-team players through injury or suspension to backing every team that has won at least four of its last five games if they are playing a team that has lost at least four of their last five games.
In horse racing systems that punters use could be backing any horse where a trainer has a certain strike rate at a course to backing any horse that has travelled a certain number of miles to their engagement.
With some fine-tuning, these systems can be profitable but they should always be thoroughly tested before staking real money.
Questions about Betting Systems
FAQ
Betting Systems FAQ's
-
The short answer is No!
You have to expect losses in any betting scenario. That is not to say the betting system itself does not work. The key thing to consider is that the betting system in question has a sufficiently high strike rate at average odds that determine a profit can be made. A couple of simple examples is that if every bet was made at evens, you could reasonably expect to have 4 losers in every ten bets to make a profit.
Conversely, if the odds were much shorter, say 1.10, you would need to average more than 9 winners for every loser to break even - Understand the maths in profitable betting and you will understand that loser are both inevitable and have to be factored into any system
-
There are many betting systems that do work, either for a short period of time or over longer.
Further up this page you can find details of some systems that have stood the test of time. Also there are some systems that you may have heard of but need to steer clear, as they do not work.
-
Rarely, and if there is one, it is unlikely the person who has the details would share the information.
The more people that know and use a betting system that works, add more pressure to the prices of the selections and the validity of the system to work over a long period of time.
To this end, if you discover a betting system that works, my advice would be not to share it. The ego boost of telling your friends about winners will cost you the profitability of the system.
-
At first you have to have an idea of what criteria you want to use to get your selections. Try to find something easy to track and set up
From there you can either check back on previous results to see how the system would have performed or paper trade your selections for a time, so as not to risk any betting bank and see how they get on before betting them for real.
-
Be a bookmaker and include an Edge in the odds you are offering. In the long term, this will ensure profit for yourself. This can be done, by acting as a bookmaker on one of the betting exchanges.
To understand how betting odds work in favour of the bookmakers, you should check the Understanding betting odds section.
Good luck, this is the most likely money-making scenario of any betting system you create or follow.
Further Reading on Betting Systems
The OLBG website has been active since the early 2000's.
In that time, the thousands of members that have come through the door and still actively contribute to the site have added a wealth of experience, expertise and information on betting systems.
The following articles have stood the test of time for punters looking for more insight in how to build, maintain and manage successful systems, and also, what to avoid.
Betting System Blogs and Bloggers on OLBG
Scratvilles Horse Racing Trainers to Follow
Long time OLBG Blogger Scratville completes a monthly review of which horse racing trainers should be followed based on long terms month by month records in the past. He has been doing this for several years now and has found a system that throws up more than enough qualifiers to keep even the most avid horse racing punter interested, and throws in lots of profit to boot. For more information, hit the link or look at the Betting Systems that work section further up this article.
Man O Bongs, Best System Ever
Not really highlighting a single system but rather looking into why systems succeed and why many fail. An interesting read.
Profitable Horse Racing Betting System - Using The VALUE CALCULATOR To Assess Handicap Hurdle Races
A more narrow system approach to a specific type of horse race. This system looks at identifying value betting opportunities within handicap hurdle races in horse racing. Something for the winter.
Profitable Horse Racing Betting System - Racing Post Ratings Improvers?
Another horse racing system from the same author as the one above. Robmull looks at how racing post ratings can be used to find winners. This is an depth look with lots of angles, past results and an easy to follow set of rules to find qualifying bets.
Introducing the VALUE CALCULATOR
Prolific OLBG systemite blogger Robmull again shows us how we can use free tools available on the internet to asses horse racing and find bets that are perceived as value based on a systematic approach.
The System v Gut Feeling Debate
Do you use a system or does gut feeling serve your better? Is it possible to find a system that can say with a known degree of certainty, what the outcome of an event will be?
Creating a Value Betting System for English Football
This football betting system from Man o Bong did show some fantastic results from betting on UK football through all the leagues. Even when huge numbers of selections where chosen. One of the free resources that were used is no longer available but this remains a valuable resource is demonstrating how a free football rating system can be used in conjunction to find potential bets in English football, and how to create a football betting system using them
Responsible Gambling
Whether you go with a system or not, you must gamble responsibly. OLBG.com has always advocated this since its formation.

Responsible Gambling Features, Function and Help
Editorial Information
Since 2002 OLBG members have been discussing and adding their opinions on betting systems. We have taken their thoughts and added our betting experts input to bring you this guide to betting systems.


